

Question: someone please help, I've been trying to get this done for days, In desperate need please... Now that your topic questions have been approved, it
someone please help, I've been trying to get this done for days, In desperate need please...
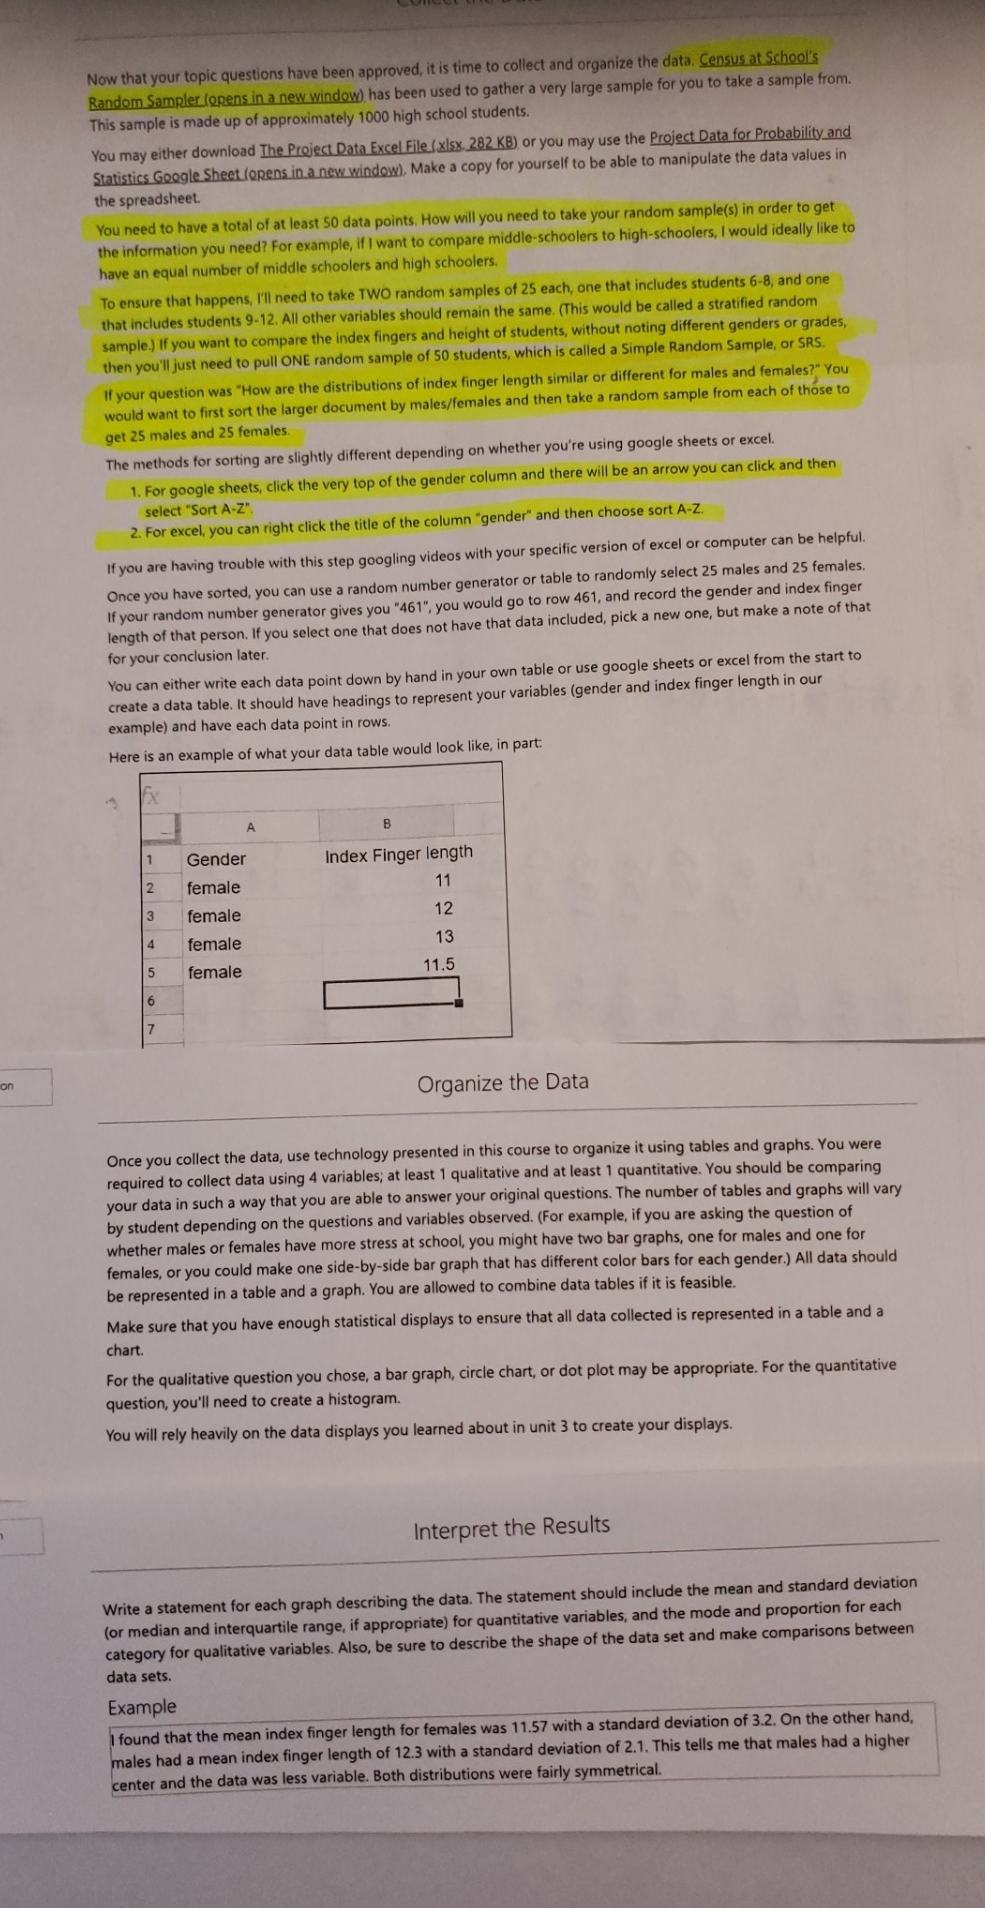
Now that your topic questions have been approved, it is time to collect and organize the data. Census at School's Random Sampler (opens in a new window), has been used to gather a very large sample for you to take a sample from. This sample is made up of approximately 1000 high school students. You may either download The Project Data Excel File (xisx. 282 KB), or you may use the Project Data for Probability and Statistics Google Sheet (opens in a new window), Make a copy for yourself to be able to manipulate the data values in the spreadsheet. You need to have a total of at least 50 data points. How will you need to take your random sample(s) in order to get the information you need? For example, if I want to compare middle-schoolers to high-schoolers, I would ideally like to have an equal number of middle schoolers and high schoolers. To ensure that happens, I'll need to take TWO random samples of 25 each, one that includes students 6-8, and one that includes students 9-12. All other variables should remain the same. (This would be called a stratified random sample.) If you want to compare the index fingers and height of students, without noting different genders or grades, then you'll just need to pull ONE random sample of 50 students, which is called a Simple Random Sample, or SRS. If your question was "How are the distributions of index finger length similar or different for males and females?" You would want to first sort the larger document by males/females and then take a random sample from each of those to get 25 males and 25 females. The methods for sorting are slightly different depending on whether you're using google sheets or excel. 1. For google sheets, click the very top of the gender column and there will be an arrow you can click and then select "Sort A-Z". 2. For excel, you can right click the title of the column "gender" and then choose sort A-Z. If you are having trouble with this step googling videos with your specific version of excel or computer can be helpful. Once you have sorted, you can use a random number generator or table to randomly select 25 males and 25 females. If your random number generator gives you "461", you would go to row 461, and record the gender and index finger length of that person. If you select one that does not have that data included, pick a new one, but make a note of that for your conclusion later. You can either write each data point down by hand in your own table or use google sheets or excel from the start to create a data table. It should have headings to represent your variables (gender and index finger length in our example) and have each data point in rows. Here is an example of what your data table would look like, in part: 1 Gender Index Finger length 2 female 11 3 female 12 4 female 13 5 female 11.5 6 Organize the Data Once you collect the data, use technology presented in this course to organize it using tables and graphs. You were required to collect data using 4 variables; at least 1 qualitative and at least 1 quantitative. You should be comparing your data in such a way that you are able to answer your original questions. The number of tables and graphs will vary by student depending on the questions and variables observed. (For example, if you are asking the question of whether males or females have more stress at school, you might have two bar graphs, one for males and one for females, or you could make one side-by-side bar graph that has different color bars for each gender.) All data should be represented in a table and a graph. You are allowed to combine data tables if it is feasible. Make sure that you have enough statistical displays to ensure that all data collected is represented in a table and a chart. For the qualitative question you chose, a bar graph, circle chart, or dot plot may be appropriate. For the quantitative question, you'll need to create a histogram. You will rely heavily on the data displays you learned about in unit 3 to create your displays. Interpret the Results Write a statement for each graph describing the data. The statement should include the mean and standard deviation (or median and interquartile range, if appropriate) for quantitative variables, and the mode and proportion for each category for qualitative variables. Also, be sure to describe the shape of the data set and make comparisons between data sets. Example found that the mean index finger length for females was 11.57 with a standard deviation of 3.2. On the other hand, males had a mean index finger length of 12.3 with a standard deviation of 2.1. This tells me that males had a higher center and the data was less variable. Both distributions were fairly symmetrical
Step by Step Solution
There are 3 Steps involved in it

Get step-by-step solutions from verified subject matter experts