

Question: Can someone pleasE help with this problem on mathlab. What is the command to plot a single point (a, b, c) in a 3D graph
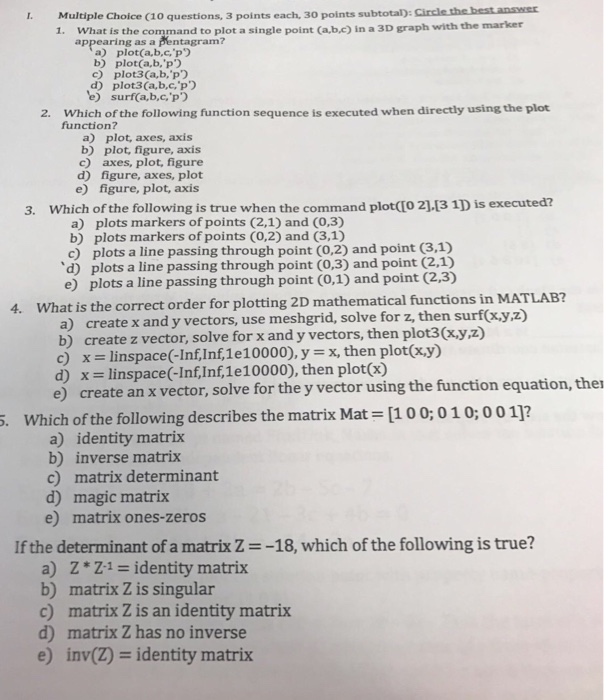
What is the command to plot a single point (a, b, c) in a 3D graph with the marker appearing as a pentagram? plot(a, b, c, 'p') plot (a, b, 'p') plot 3(a, b, 'p') plot 3(a, b, c, 'p') surf(a, b, c, 'p') Which of the following function sequence is executed when directly using the plot function? plot, axes, axis plot, figure, axis axes, plot, figure figure, axes, plot figure, plot, axis Which of the following is true when the command plot ([0 2], [3 1]) is executed? plots markers of points (2, 1) and (0, 3) plots markers of points (0, 2) and (3, 1) plots a line through (0.2) and point (3.1) plots a line passing through point (0, 3) and point (2, 1) plots a line passing through point (0, 1) and point (2, 3) What is the correct order for plotting 2D mathematical functions in MATLAB? create x and y vectors, use meshgrid, solve for z then surf(x, y, z) create z vector, solve for x and y vectors, then plot3(x, y, z) x = linspace(-Inf, Inf, 1e10000), y = x, then plot(x, y) x = linspace(-Inf, Inf, 1e10000), y = x, then plot(x) create an x vector, solve for the y vector using the function equation, then Which of the following describes the matrix Mat [100; 010; 001]? identity matrix inverse matrix matrix determinant magic matrix matrix ones-zeros If the determinant of a matrix Z = -18, which of the following is true? Z*Z^-1 = identity matrix matrix Z is singular matrix Z is an identity matrix matrix Z has no inverse inv(Z) = identity matrix
Step by Step Solution
There are 3 Steps involved in it

Get step-by-step solutions from verified subject matter experts