

Question: Can someone please help with this question. This is the third time i am posting it. I still keep getting an error message. Question. Use
Can someone please help with this question. This is the third time i am posting it. I still keep getting an error message.
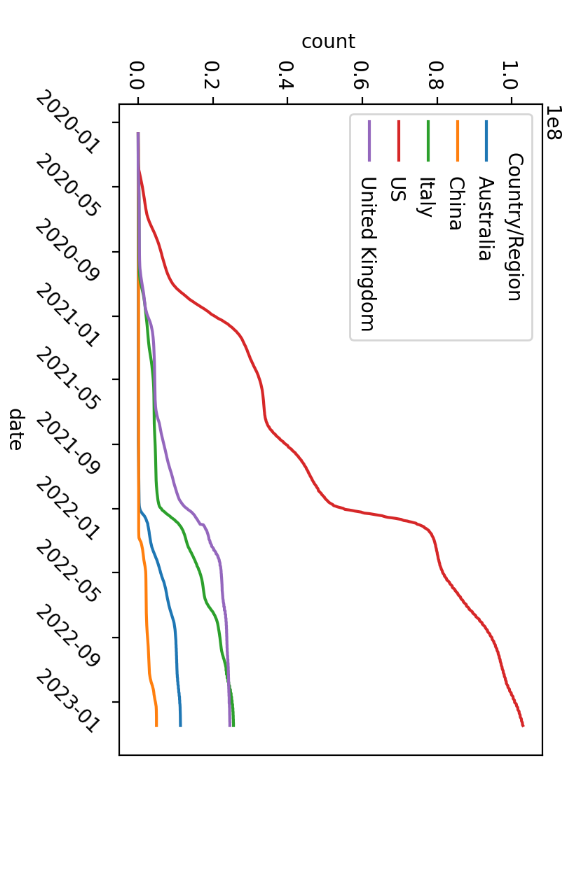
Question. Use Matplotlib or Seaborn to make the following trend plot stratified by Country/Region. An acceptable plot is shown below:
Hint: Depending on what library you are using, you may want to convert the dataset into the following in the Long Format. The Pandas function melt can be used for this operation.
Attached is what the plot looks like:
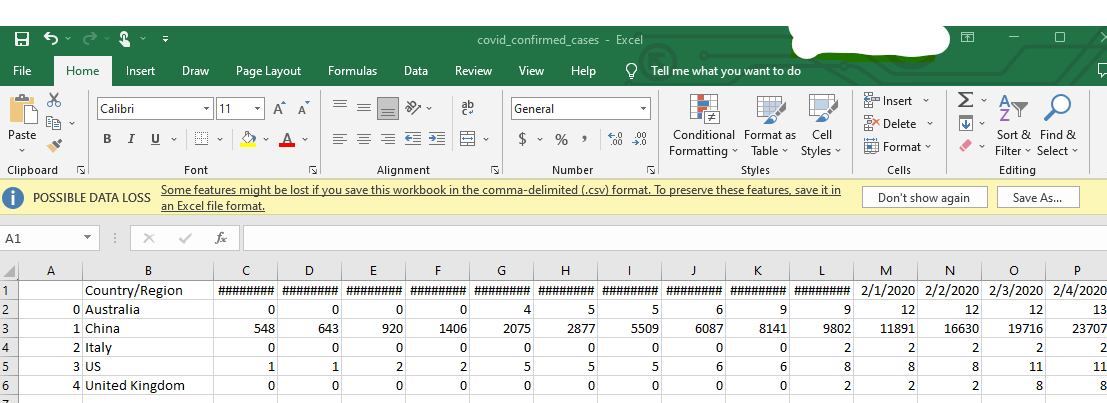
NOTE: The file is saved as covid_confirmed_cases and this is what it looks like.
NOTE: This was the error i got for my previous attempt.
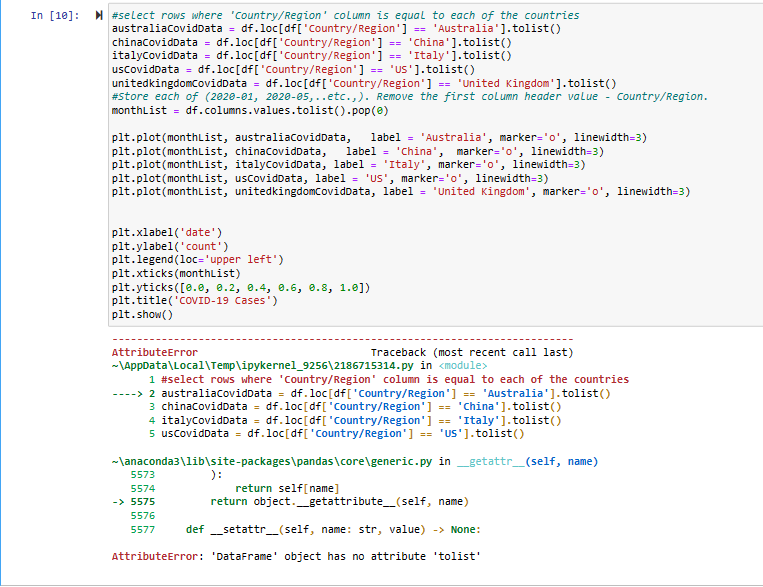
date A1
Step by Step Solution
There are 3 Steps involved in it
1 Expert Approved Answer
Step: 1 Unlock

Question Has Been Solved by an Expert!
Get step-by-step solutions from verified subject matter experts
Step: 2 Unlock
Step: 3 Unlock