

Question: can you also do the lower control limit for 3 sigma x chart and also (lcl) (UCL) for 3 signa R chart Problem 68.3 Question
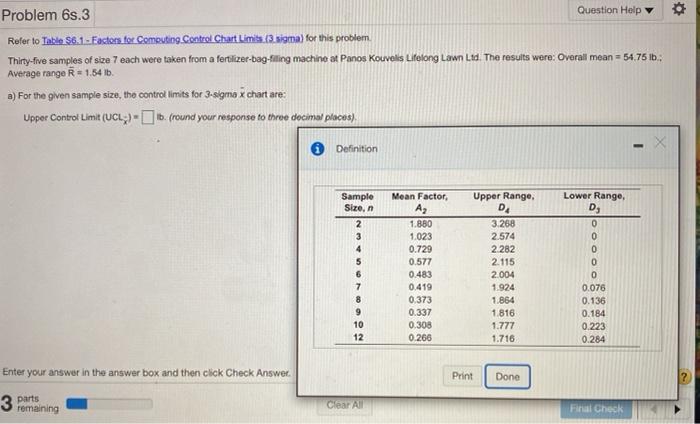
can you also do the lower control limit for 3 sigma x chart
and also
(lcl) (UCL) for 3 signa R chart
Step by Step Solution
There are 3 Steps involved in it
1 Expert Approved Answer
Step: 1 Unlock

Question Has Been Solved by an Expert!
Get step-by-step solutions from verified subject matter experts
Step: 2 Unlock
Step: 3 Unlock