

Question: can you answer please Question 13(1 point) You will need to represent your teams data in graphical format for this project. Using your preferred graphing
can you answer please 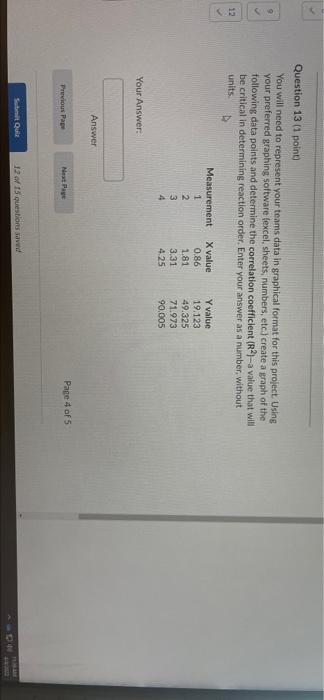
Question 13(1 point) You will need to represent your teams data in graphical format for this project. Using your preferred graphing software (excel, sheets, numbers, etc.) create a graph of the following data points and determine the correlation coefficient (R)-a value that will be critical in determining reaction order. Enter your answer as a number, without units 12 Measurement 1 2 3 4 X value 0.86 1.81 3.31 4.25 Y value 19.123 49.325 71.973 90.005 Your Answer: Answer Previous Paper Next Page Page 4 of 5 S QUE 12 of 15 questions and
Step by Step Solution
There are 3 Steps involved in it
1 Expert Approved Answer
Step: 1 Unlock

Question Has Been Solved by an Expert!
Get step-by-step solutions from verified subject matter experts
Step: 2 Unlock
Step: 3 Unlock