

Question: Question 12 (1 point) You will need to represent your teams data in graphical format for this project. Using your preferred graphing software (excel,
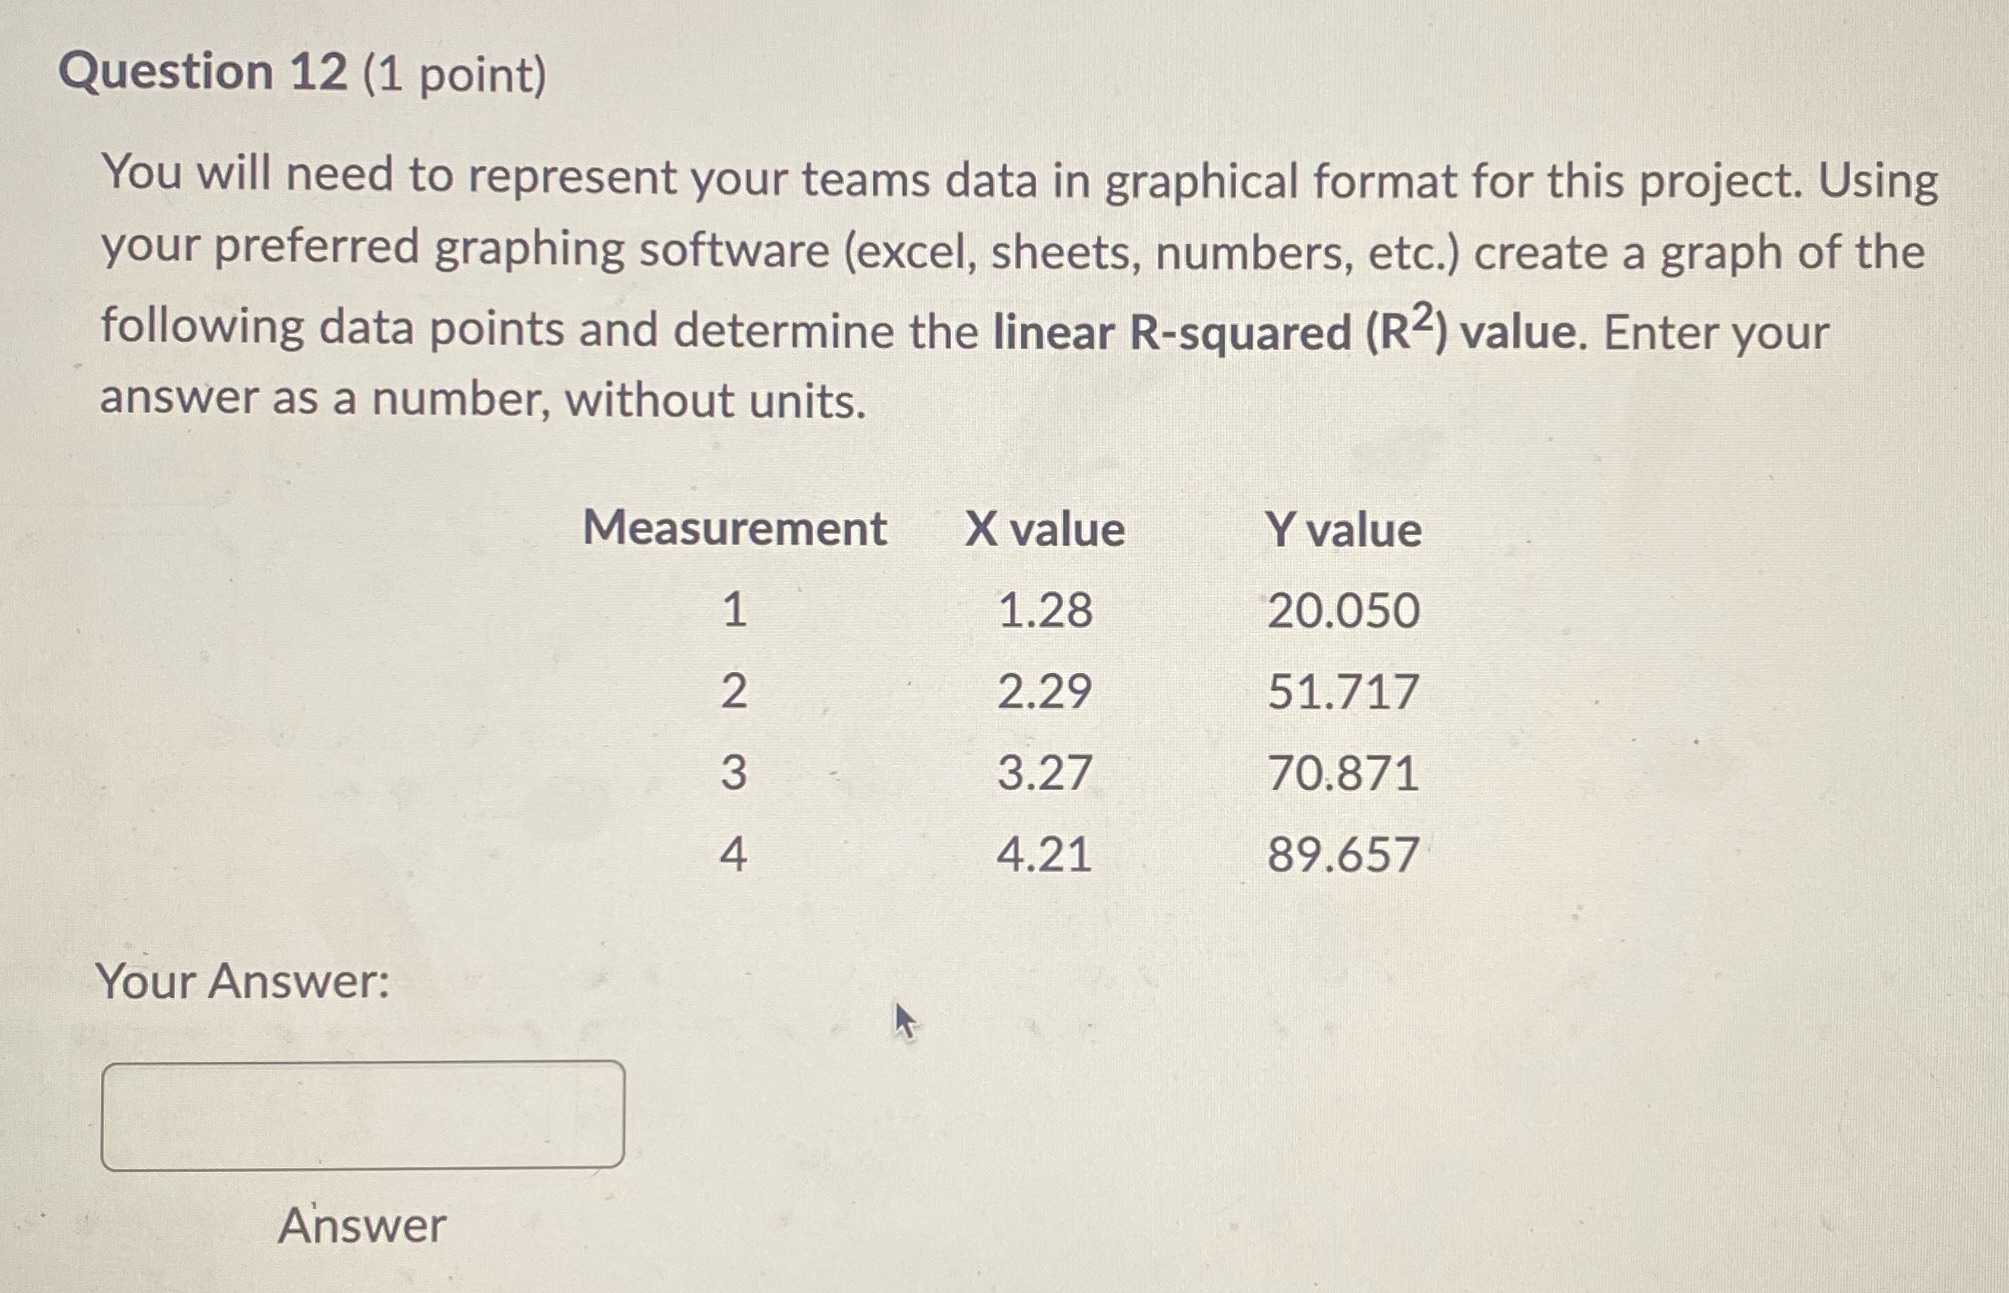
Question 12 (1 point) You will need to represent your teams data in graphical format for this project. Using your preferred graphing software (excel, sheets, numbers, etc.) create a graph of the following data points and determine the linear R-squared (R2) value. Enter your answer as a number, without units. Your Answer: Answer Measurement X value Y value 1 1.28 20.050 2 2.29 51.717 34 3.27 70.871 4.21 89.657
Step by Step Solution
There are 3 Steps involved in it
1 Expert Approved Answer
Step: 1 Unlock

Question Has Been Solved by an Expert!
Get step-by-step solutions from verified subject matter experts
Step: 2 Unlock
Step: 3 Unlock