

Question: Can you answer these questions please? Gizmo Warm-up When one variable is related to another, the two variables are said to be correlated. In many
Can you answer these questions please?
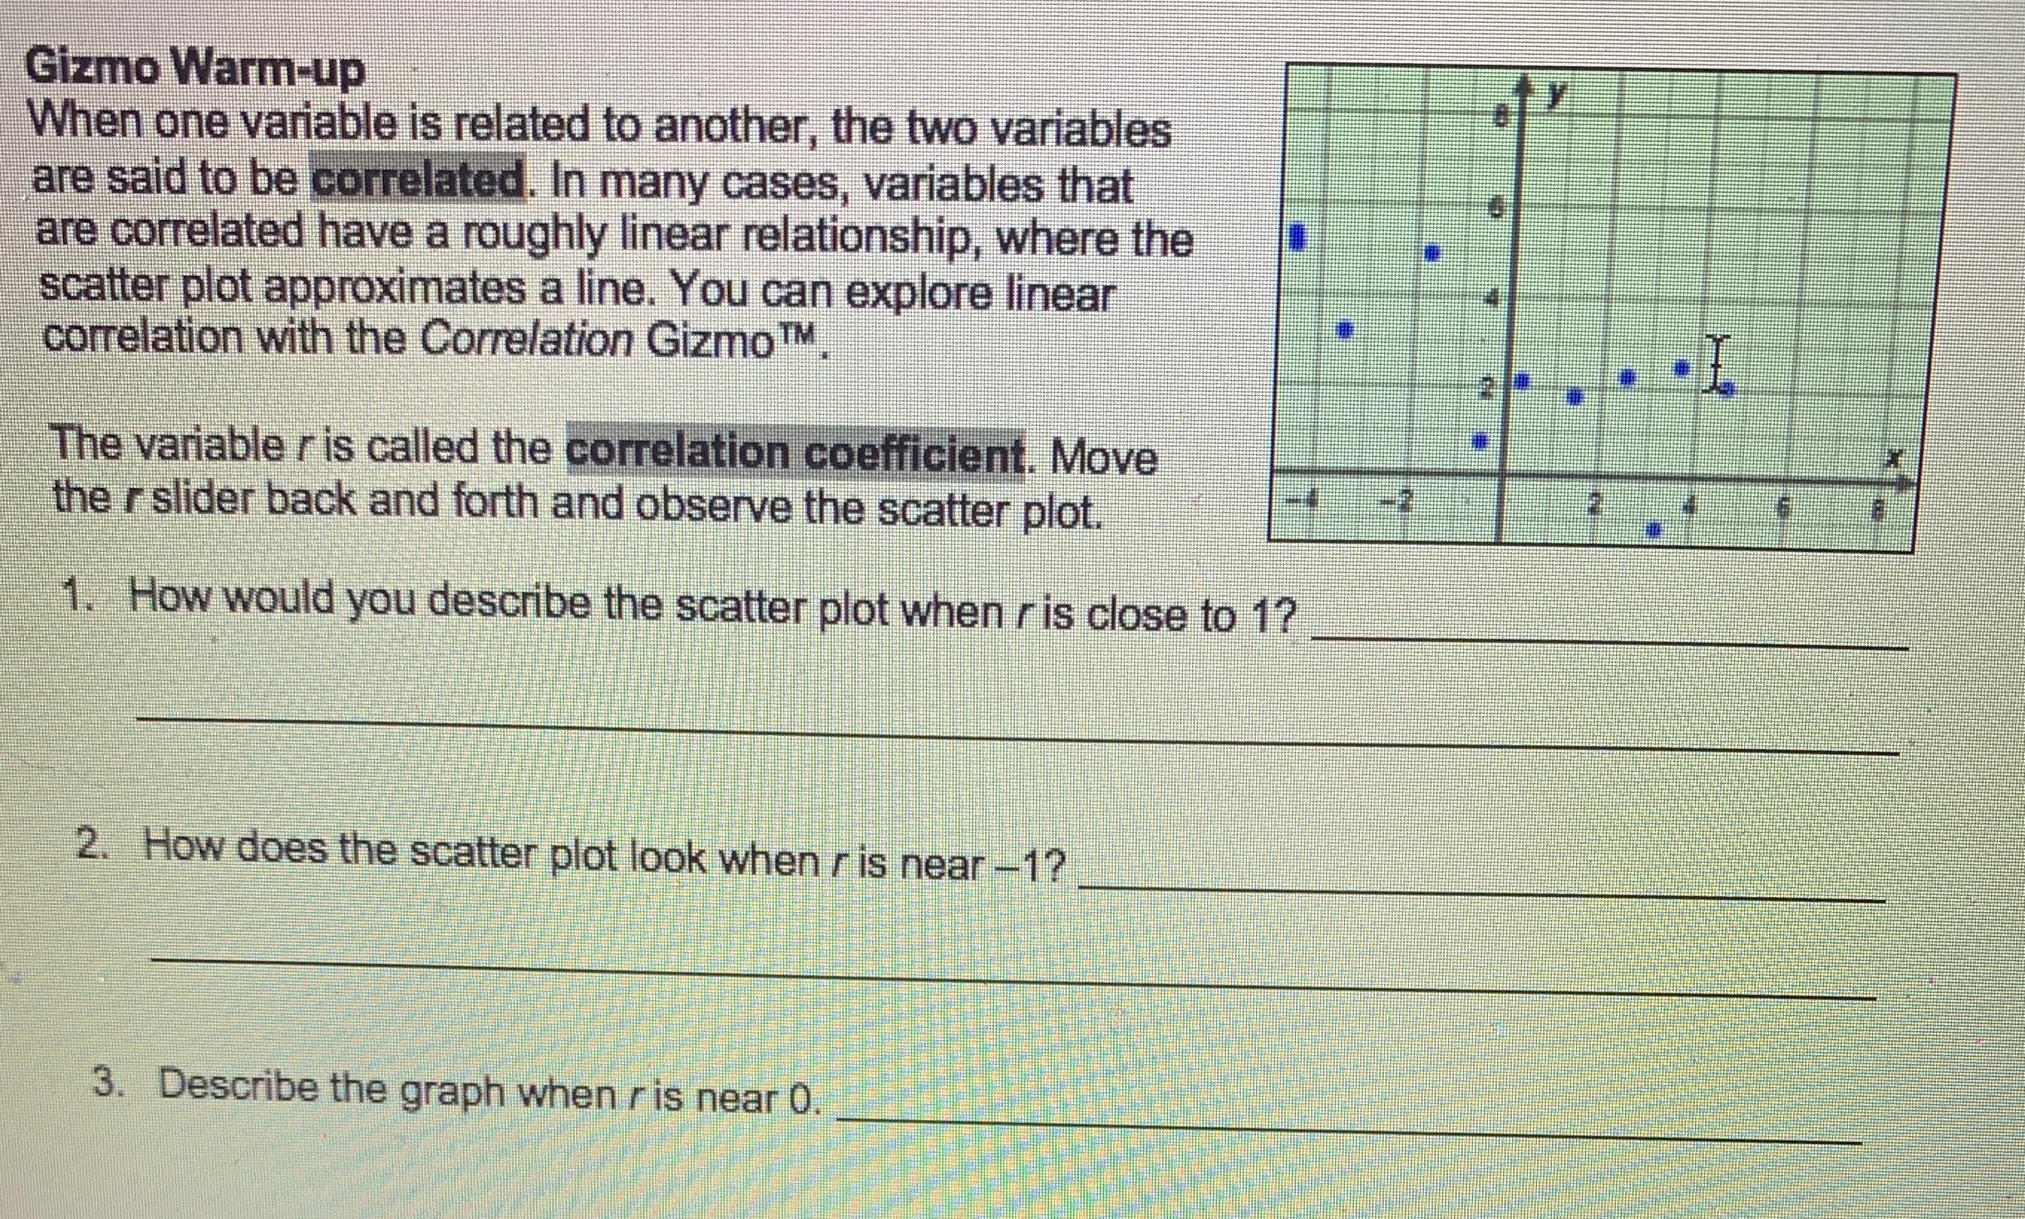
Gizmo Warm-up When one variable is related to another, the two variables are said to be correlated. In many cases, variables that are correlated have a roughly linear relationship, where the scatter plot approximates a line. You can explore linear correlation with the Correlation Gizmo TM. The variable r is called the correlation coefficient. Move the r slider back and forth and observe the scatter plot. 1. How would you describe the scatter plot when / is close to 1? 2. How does the scatter plot look when r is near -1? 3. Describe the graph when r is near 0
Step by Step Solution
There are 3 Steps involved in it
1 Expert Approved Answer
Step: 1 Unlock

Question Has Been Solved by an Expert!
Get step-by-step solutions from verified subject matter experts
Step: 2 Unlock
Step: 3 Unlock