

Question: can you explain the data please. can you explain the data using percentages. Are unvaccinated people (according to the table) more likely to develop autism
 can you explain the data please. can you explain the data using percentages.
Are unvaccinated people (according to the table) more likely to develop autism than non vaccinated people. Can you explain this in percentages.
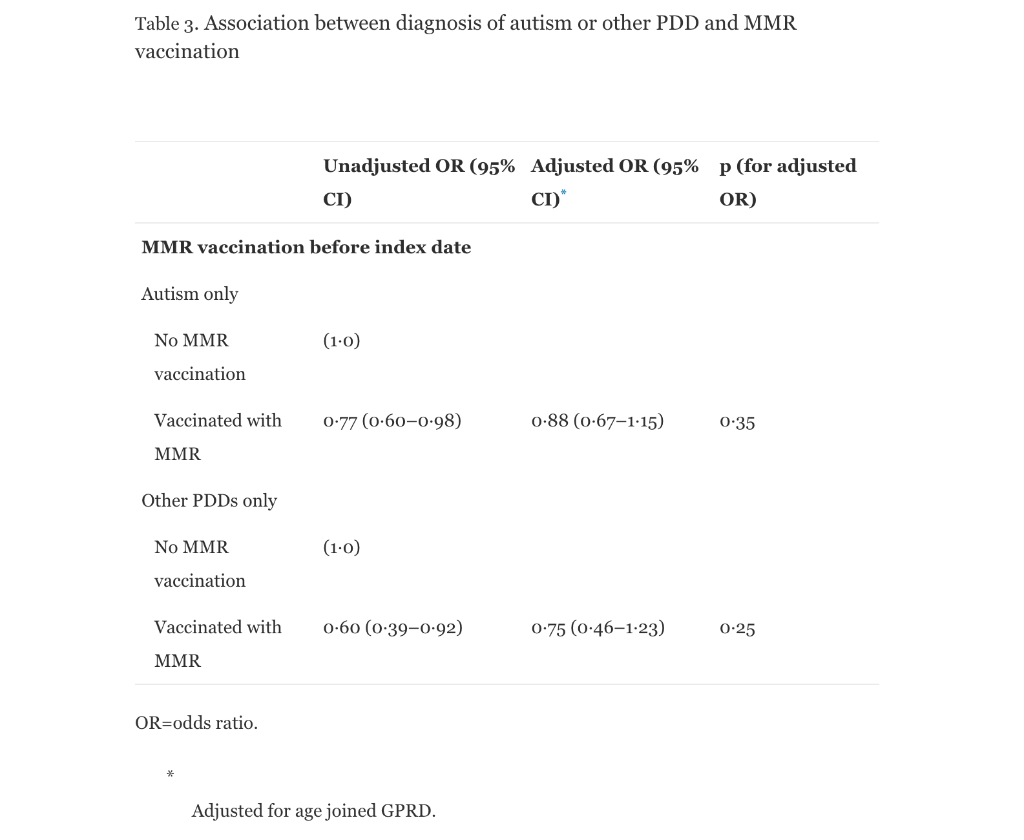
Table 3. Association between diagnosis of autism or other PDD and MMR vaccination Unadjusted OR (95% Adjusted OR (95% p (for adjusted CI) CI)* OR) MMR vaccination before index date Autism only No MMR (1.0) vaccination Vaccinated with 0.77 (0.60-0.98) 0.88 (0-67-1.15) 0:35 MMR Other PDDs only No MMR (1:0) vaccination Vaccinated with 0-60 (0-39-0.92) 0.75 (0.461.23) 0.25 MMR OR=odds ratio. Adjusted for age joined GPRD. Table 3. Association between diagnosis of autism or other PDD and MMR vaccination Unadjusted OR (95% Adjusted OR (95% p (for adjusted CI) CI)* OR) MMR vaccination before index date Autism only No MMR (1.0) vaccination Vaccinated with 0.77 (0.60-0.98) 0.88 (0-67-1.15) 0:35 MMR Other PDDs only No MMR (1:0) vaccination Vaccinated with 0-60 (0-39-0.92) 0.75 (0.461.23) 0.25 MMR OR=odds ratio. Adjusted for age joined GPRD
Step by Step Solution
There are 3 Steps involved in it

Get step-by-step solutions from verified subject matter experts