

Question: Can you explain these 5 questions and give an example. I don't understand this. I'm on virtual classes. No teachers there. Thanks A professor has
Can you explain these 5 questions and give an example. I don't understand this. I'm on virtual classes. No teachers there. Thanks
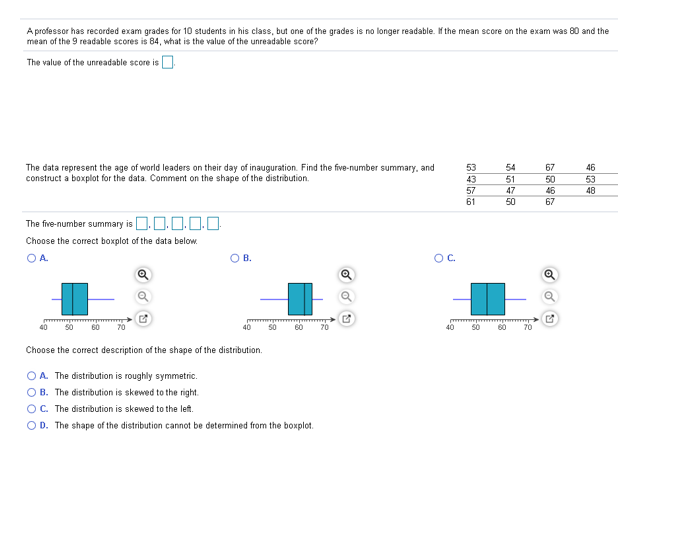
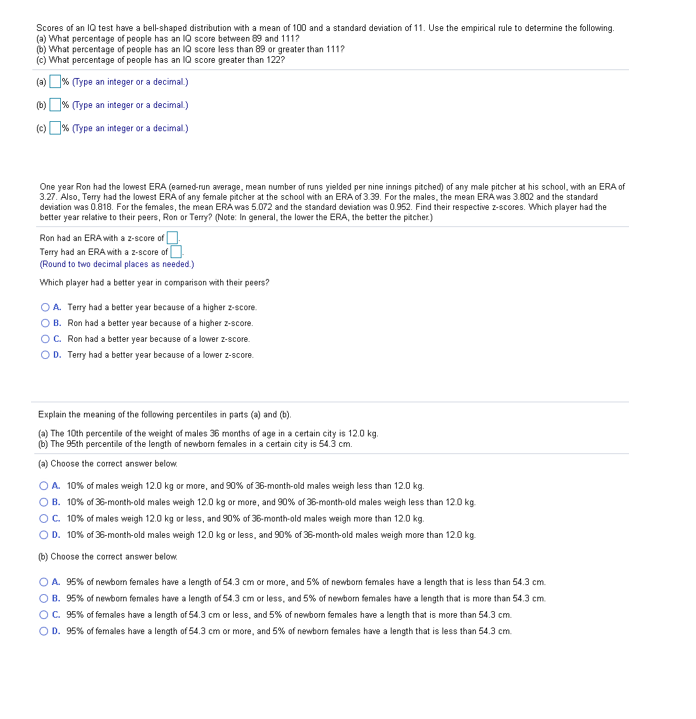
A professor has recorded exam grades for 10 students in his class, but one of the grades is no longer readable. If the mean score on the exam was 80 and the mean of the 9 readable scores is 84, what is the value of the unreadable score? The value of the unreadable score is]. The data represent the age of world leaders on their day of inauguration. Find the five-number summary, and construct a boxplot for the data. Comment on the shape of the distribution. 53 54 50 9698 The five-number summary is. 0. 0. O. 0 Choose the correct boxplot of the data below. OA O B. OC. 40 Choose the correct description of the shape of the distribution. O A. The distribution is roughly symmetric. B. The distribution is skewed to the right. O C. The distribution is skewed to the left. O D. The shape of the distribution cannot be determined from the boxplot.Scores of an IQ test have a bell-shaped distribution with a mean of 100 and a standard deviation of 11. Use the empirical rule to determine the following. (a) What percentage of people has an IQ score between 69 and 111? (o) What percentage of people has an IO score less than 89 or greater than 111? [c) What percentage of people has an IQ score greater than 122? (3) |% (Type an integer or a decimal ) (5) |% (Type an integer or a decimal ) (c) % (Type an integer or a decimal ) One year Ron had the lowest ERA (eamed-run average, mean number of runs yielded per nine innings pitched) of any male pitcher at his school, with an ERA of 3.27. Also. Terry had the lowest ERA of any female pitcher at the school with an ERA of 3.39. For the males, the mean ERA was 3.802 and the standard deviation was 0.818. For the females, the mean ERA was 5.072 and the standard deviation was 0.952. Find their respective z-scores. Which player had the better year relative to their peers, Ron or Terry? (Note: In general, the lower the ERA, the better the pitcher) Ron had an ERA with a z-score of [ Terry had an ERA with a z-score of Round to two decimal places as needed.) Which player had a better year in comparison with their peers? O A. Terry had a better year because of a higher z-score. O B. Ron had a better year because of a higher z-score. O C. Ron had a better year because of a lower z-score. O D. Terry had a better year because of a lower z-score. Explain the meaning of the following percentiles in parts (@) and (b). () The 10th percentile of the weight of males 36 months of age in a certain city is 12.0 kg. (b) The 951h percentile of the length of newborn females in a certain city is 54.3 cm. (=) Choose the correct answer below O A. 10% of males weigh 12.0 kg or more, and 90% of 36-month-old males weigh less than 12.0 kg. O B. 10% of 35-month-old males weigh 12.0 kg or more, and 90% of 36-month-old males weigh less than 12 0 kg O C. 10% of males weigh 12.0 kg or less, and 90%% of 36-month-old males weigh more than 12.0 kg O D. 10% of 36-month-old males weigh 12.0 kg or less, and 90% of 36-month-old males weigh more than 12 0 kg. (b) Choose the correct answer below O A. 95% of newbom females have a length of 54.3 cm or more, and 5% of newborn fernales have a length that is less than 54.3 cm. O B. 95% of newborn females have a length of 54.3 crn or less, and 5% of newbom females have a length that is more than 54.3 cm. O C. 95% of females have a length of 54.3 cm or less, and 5% of newbom females have a length that is more than 54.3 cm. O D. 95% of females have a length of 54.3 crn or more, and 5% of newborn fernales have a length that is less than 54.3 cmn
Step by Step Solution
There are 3 Steps involved in it

Get step-by-step solutions from verified subject matter experts