

Question: Can you help me solve these ratios. Also, is operating profit margin and times interest earned supposed to be negative from this data given ?
Can you help me solve these ratios. Also, is operating profit margin and times interest earned supposed to be negative from this data given ?
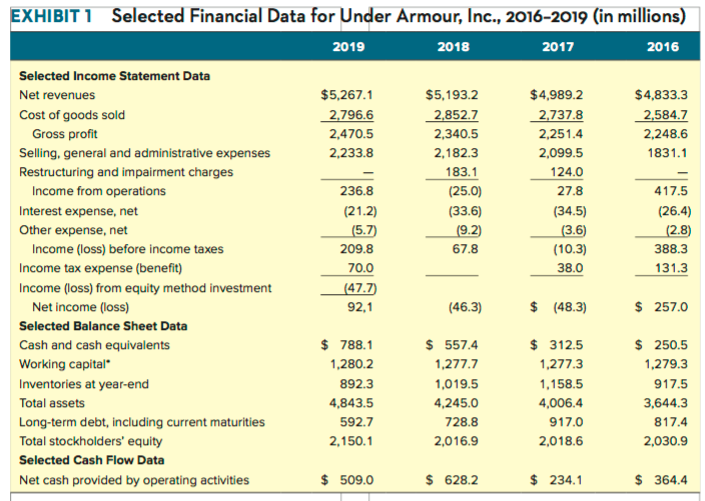
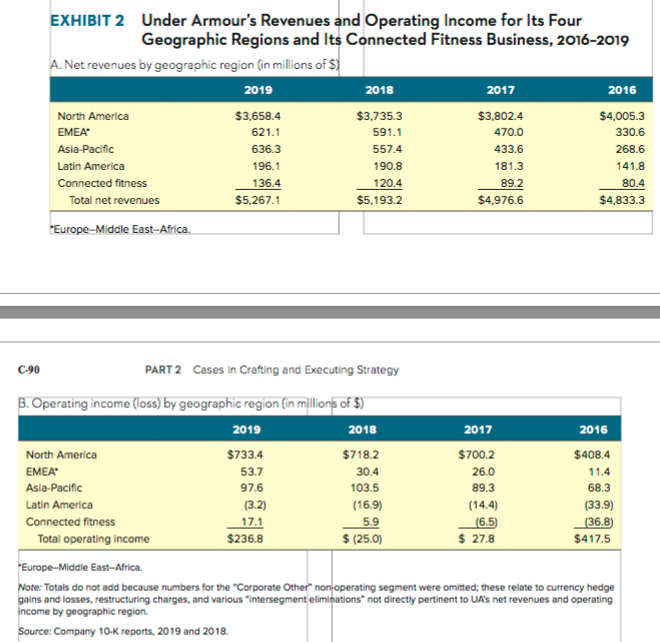
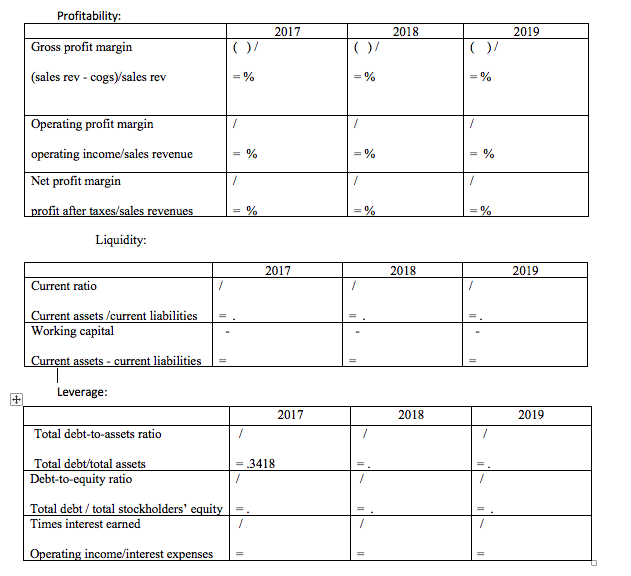
EXHIBIT 1 Selected Financial Data for Under Armour, Inc., 2016-2019 (in millions) 2019 2018 2017 2016 Selected Income Statement Data Net revenues $5,267.1 $5,193.2 $4,989.2 $4,833.3 2,796.6 2,470.5 2,584.7 2,248.6 2,233.8 2,737.8 2,251.4 2,099.5 124.0 27.8 1831.1 2,852.7 2,340.5 2,182.3 183.1 (25.0) (33.6) (9.2) 67.8 236.8 Cost of goods sold Gross profit Selling, general and administrative expenses Restructuring and impairment charges Income from operations Interest expense, net Other expense, net Income (loss) before income taxes Income tax expense (benefit) Income (loss) from equity method investment Net income (loss) 417.5 (21.2) (34.5) (5.7) 209.8 (3.6) (10.3) 38.0 (26.4) (2.8) 388.3 131.3 70.0 (47.7) 92,1 (46.3) $ (48.3) $ 257.0 Selected Balance Sheet Data $ 788.1 $ 557.4 $ 312.5 $ 250.5 1,280.2 1,277.7 1,277.3 1,279.3 892.3 1,019.5 917.5 Cash and cash equivalents Working capital Inventories at year-end Total assets Long-term debt, including current maturities Total stockholders' equity Selected Cash Flow Data 1,158.5 4,006.4 4,843.5 4,245.0 3,644.3 592.7 728.8 917.0 817.4 2,150.1 2,016.9 2,018.6 2,030.9 Net cash provided by operating activities $ 509.0 $ 628.2 $ 234.1 $364.4 EXHIBIT 2 Under Armour's Revenues and Operating Income for Its Four Geographic Regions and Its Connected Fitness Business, 2016-2019 A. Net revenues by geographic region (in millions of 5) 2019 2018 2017 2016 North America $3,658.4 $3,735.3 $3,802.4 $4,005.3 EMEA 621.1 591.1 470.0 330.6 Asia-Pacific 636.3 557.4 433.6 268.6 Latin America 196.1 190.8 181.3 141.8 Connected fitness 136.4 120.4 89.2 80.4 Total net revenues $5,267.1 $5.193.2 $4.976.6 $4,833.3 'Europe - Middle East Africa. 0.90 PART 2 Cases in Crafting and Executing Strategy B. Operating income (loss) by geographic region (in millions of $) 2019 2018 2017 2016 North America $733.4 $700.2 EMEA 53.7 11.4 Asia-Pacific 97.6 89.3 68.3 Latin America Connected fitness $718.2 $408.4 30.4 26.0 103.5 (3.2) (16.9) (14.4) (33.9) 17.1 5.9 (6.5) (36.8) Total operating income $236.8 $ (25.0) $ 27.8 $417.5 Europe-Middle East Africa. Note: Totals do not add because numbers for the "Corporate Other non-operating segment were omitted; these relate to currency hedge gains and losses, restructuring charges, and various intersegment eliminations not directly pertinent to UA's net revenues and operating Income by geographic region Source: Company 10-K reports, 2019 and 2018 Profitability: 2017 2018 2019 Gross profit margin ()/ ()/ (sales rev - cogs/sales rev =% = % =% Operating profit margin 1 operating income/sales revenue = % =% = % Net profit margin 1 / profit after taxes/sales revenues = % = % = % Liquidity: 2017 2018 2019 Current ratio 1 Current assets/current liabilities Working capital Current assets - current liabilities Leverage: 2017 2018 2019 Total debt-to-assets ratio .3418 Total debt/total assets Debt-to-equity ratio / Total debt / total stockholders' equity =. Times interest earned / 1 Operating income/interest expenses =
Step by Step Solution
There are 3 Steps involved in it

Get step-by-step solutions from verified subject matter experts