

Question: Can you help me understand the solution to this stats problem? I know how the probability was obtained in the first table, but I don't
Can you help me understand the solution to this stats problem? I know how the probability was obtained in the first table, but I don't understand the second table. Where did the values of p(x) come from?
Here is the question:
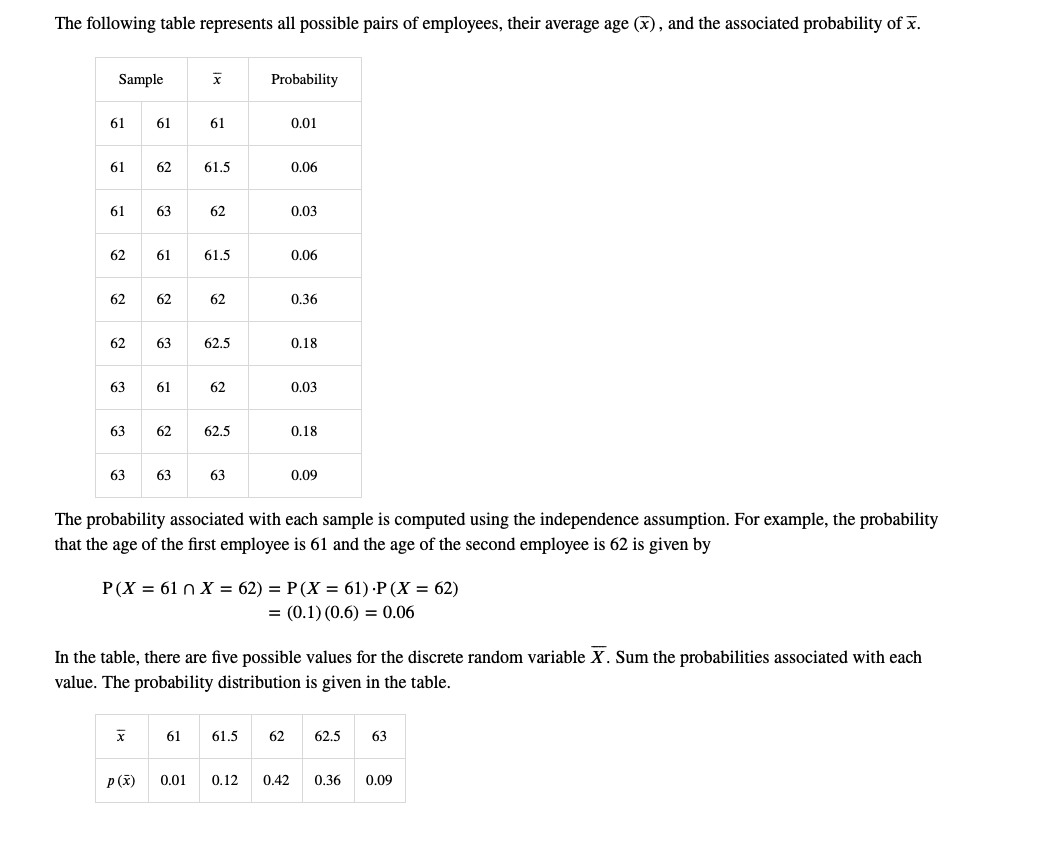
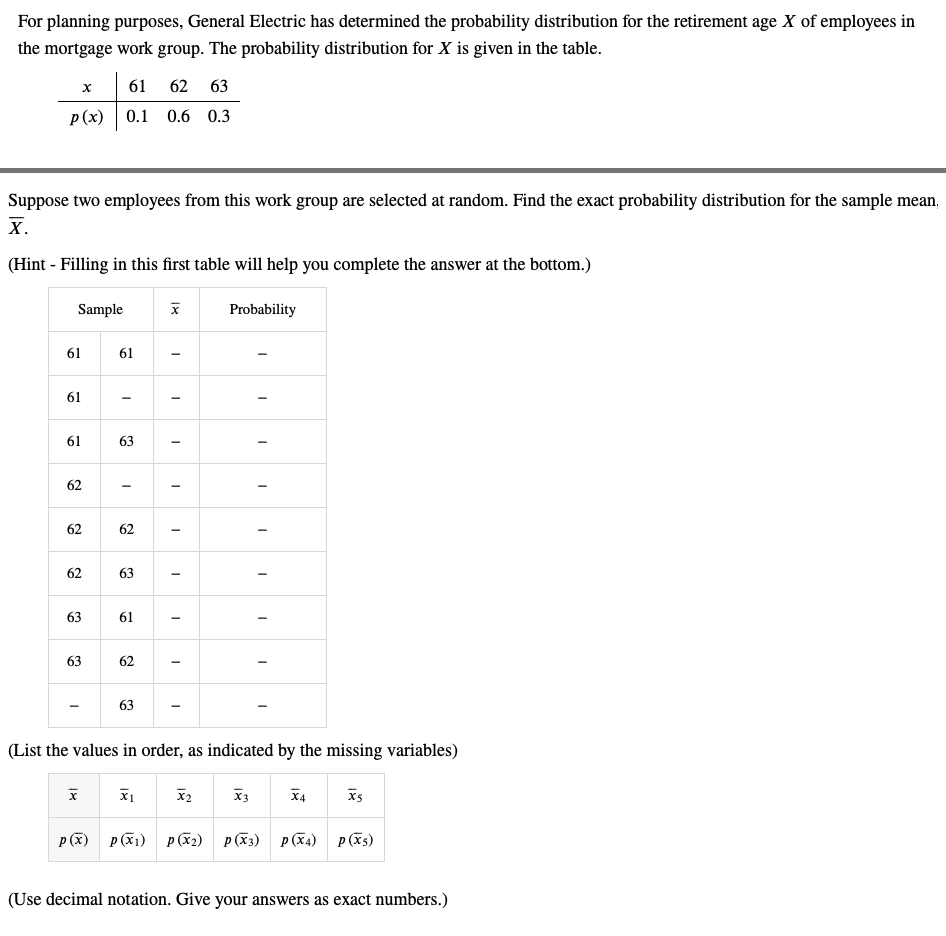
The following table represents all possible pairs of employees, their average age (x), and the associated probability of x. Sample Probability 61 67 0.01 62 61.5 D.06 61 63 62 0.03 62 61 61.5 D.06 62 62 62 0.36 63 62.5 0.18 63 61 62 0.03 63 62 62.5 0.18 63 63 63 0.09 The probability associated with each sample is computed using the independence assumption. For example, the probability that the age of the first employee is 61 and the age of the second employee is 62 is given by P(X = 61 n X = 62) = P(X = 61) .P(X = 62) = (0.1) (0.6) = 0.06 In the table, there are five possible values for the discrete random variable X. Sum the probabilities associated with each value. The probability distribution is given in the table. X 61 61.5 62 62.5 63 P (x) 0.01 0.12 0.42 0.36 0.09For planning purposes, General Electric has determined the probability distribution for the retirement age X of employees in the mortgage work group. The probability distribution for X is given in the table. 3: 61 62 63 p[x} 0.1 0.6 0.3 Suppose two employees from this work group are selected at random. Find the exact probability distribution for the sample mean. 3?. [Hint - Filling in this rst table will help you complete the answer at the bottom.) Sample 3? Probability 61 til - 61 _ 61 63 - 62 _ _ 62 62 - _ 62 63 - 63 61 - _ 63 62 - _ .53 _ _ (List the values in order, as indicated by the missing variables] Y :51 1:2 X3 14. 15 at?) 1151) M52) 1153) M54) M55) [Use decimal notation. Give your answers as exact numbers.)
Step by Step Solution
There are 3 Steps involved in it

Get step-by-step solutions from verified subject matter experts