

Question: Can you help me with the question 2? Your team has been hired as financial analysts by Meridian Banking Corporation. The bank requires your team

Can you help me with the question 2?
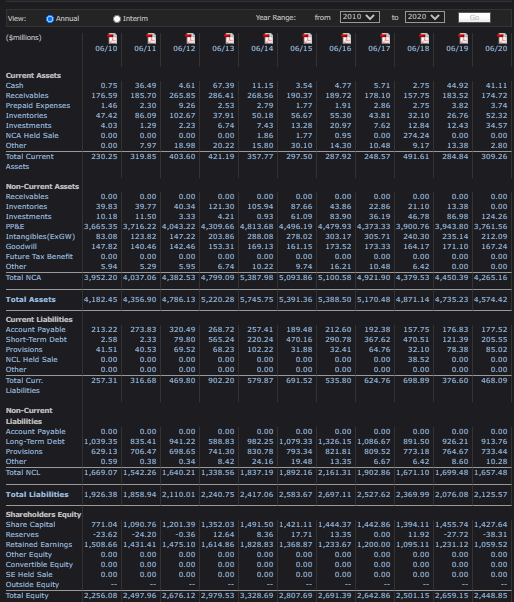
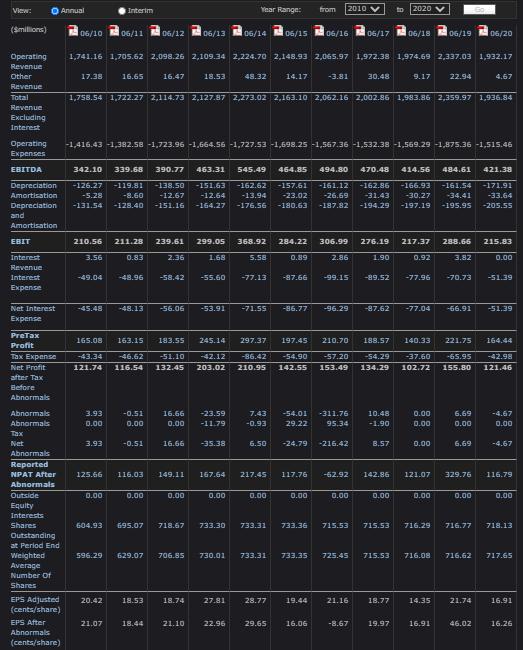
Your team has been hired as financial analysts by Meridian Banking Corporation. The bank requires your team to analyse the financial position and performance of the above assigned companies for the two stated financial years (2018 and 2019), to determine whether the companies are eligible for a loan from the bank. Your task involves answering the following 5 questions in your own words (i.e. do not simply "cut and paste information from the Annual Report or any other source). You must apply critical thinking concepts when explaining and justifying your choices. NB: Ensure that you refer to the marking criteria prior to commencing the assignment. BASED ON THE INFORMATION AVAILABLE ON THE DatAnalysis Premium DATABASE FOR BOTH ASSIGNED COMPANIES, ANSWER ALL OF THE FOLLOWING QUESTIONS (1 TO 5 INCLUSIVE). QUESTION 1: Analyse the sources of finance for each of the two companies in 2019 as compared to 2018. Use two capital structure ratios to support your answer and provide an explanation regarding the changes in the composition of the sources of finance for each enterprise. Note: ensure that you analyse in this question, not just describe the ratio values. (2 marks) QUESTION 2: For each of the two companies, analyse their ability to successfully manage each of their categories of expenses in 2019 as compared to 2018. Use three profit margin ratios to support your answer and explain any change in the ability of each company to control costs. Note: ensure that you analyse in this question, not just describe the ratio values. (3 marks) View Annual Interim Year Range: from 2010 to 2020 (smilions) 06/10 06/11 06/12 06/13 06/14 06/15 06/16 06/17 06/18 06/19 06/20 67.39 Current Assets Cash Recevables Prepaid Expenses Inventories Investments NCA Held Sale Other Total Current Assets 0.75 176.59 1.46 47.42 4.03 0.00 0.00 230.25 36.49 185.70 2.30 86.09 1.29 0.00 7.97 319.85 4.61 265.85 9.26 102.67 2.23 0.00 18.98 403.60 286.41 2.53 37.91 6.74 0.00 20.22 421.19 11.15 268.56 2.79 50.18 7.43 1.86 15.80 357.77 3.54 190.37 1.77 56.67 13.28 1.77 30.10 297.50 4.77 189.72 1.91 55.30 20.97 0.95 14.30 287.92 5.71 178.10 2.86 43.81 7.62 0.00 10.48 248.57 2.75 157.75 2.75 32.10 12.84 274.24 9.17 491.61 44.92 183.52 3.82 26.76 12.43 0.00 13.38 41.11 174.72 3.74 52.32 34.57 0.00 2.80 309.26 284.84 Non-Current Assets Receivables Inventories Investments PPHE Intangibles(ExGW) Goodwill Future Tax Benefit Other Total NCA 0.00 0.00 0.00 0.00 0.00 0.00 0.00 0.00 0.00 0.00 0.00 39.83 39.77 40.34 121.30 105.94 87.66 43.86 22.86 21.10 13.30 0.00 10.18 11.50 3.33 4.21 0.93 61.09 83.90 36.19 46.78 86.98 124.26 3,665.35 3,716.22 4,043.22 4,309.66 4.813.68 4,496.19 4,479.93 4,373.33 3,900.76 3,943.80 3,761.56 83.08 123.82 147.22 203.86 288.08 278.02 303.17 305.71 240.30 235.14 212.09 147.82 140.46 142.46 153.31 169.13 161.15 173.52 173.33 164.17 171.10 167.24 0.00 0.00 0.00 0.00 0.00 0.00 0.00 0.00 0.00 0.00 0.00 5.94 5.29 5.95 6.74 10.22 9.74 16.21 10.48 6.42 0.00 0.00 3,952.20 4,037.06 4,382.53 4,799.09 5,387.98 5,093.86 5,100.58 4,921.90 4,379.53 4,450.39 4,265.16 Total Assets 4,182.45 4,356.90 4,786.13 5.220.28 5.745.75 5,391.36 5,388.50 5,170.48 4,871.14 4,735.23 4,574.42 Current Liabilities Account Payable Short-Term Debt Provisions NCL Held Sale Other Total Curr. Liabilities 213.22 2.58 41.51 0.00 0.00 273.83 2.33 40.53 0.00 0.00 320.49 79.80 69.52 0.00 0.00 268.72 565.24 68.23 0.00 0.00 257.41 220.24 102.22 0.00 0.00 189.48 470.16 31.88 0.00 0.00 691.52 212.60 290.78 32.41 0.00 0.00 192.38 367.62 64.76 0.00 0.00 157.75 470.51 32.10 38.52 0.00 698.89 176,83 121.39 78.38 0.00 0.00 376.60 177.52 205.55 85.02 0.00 0.00 257.31 316.68 469.80 902.20 579.87 535,80 624.76 468.09 Non-Current Liabilities Account Payable Long-Term Debt Provisions Other Total NCL 0.00 0.00 0.00 0.00 0.00 0.00 0.00 0.00 0.00 0.00 0.00 1,039.35 835.41 941.22 588.83 982.25 1,079.33 1,326.15 1.086.67 891.50 926.21 913.76 629.13 706.47 698.65 741.30 830.78 793.34 821.81 809.52 773.18 764.67 733.44 0.59 0.38 0.34 8.42 24.16 19.48 13.35 6.67 6.42 8.60 10.28 1,669.07 1,542.26 1,640.21 1,338.56 1,837.19 1,892.16 2,161.31 1,902.86 1,671.10 1,699.48 1,657.48 Total Liabilities 1,926.38 1,858.94 2.110.01 2,240.75 2,417.06 2,583.67 2,697.11 2,527.62 2,369.99 2,076.08 2.125.57 Shareholders Equity Share Capital Reserves Retained Earnings Other Equity Convertible Equity SE Held Sale Outside Equity Total Equity 771.04 1,090.76 1,201.39 1,352.03 1,491.50 1,421.11 1,444.37 1,442.86 1,394.11 1,455.74 1,427.64 -23.62 -24.20 -0.36 12.64 8.36 17.71 13.35 0.00 11.92 -27.72 1,508.66 1,431.41 1,475.10 1,614.86 1,828.83 1,368.87 1,233.67 1,200.00 1,095.11 1,231.12 1,059.52 -38.31 0.00 0.00 0.00 0.00 0.00 0.00 0.00 0.00 0.00 0.00 0.00 0.00 0.00 0.00 0.00 0.00 0.00 0.00 0.00 0.00 0.00 0.00 0.00 0.00 0.00 0.00 0.00 0.00 0.00 0.00 0.00 0.00 0.00 2,256.08 2,497.96 2,676.12 2.979.53 3,328.69 2.807.69 2,691.39 2,642.86 2,501.15 2,659.15 2,448.85 View: Annual Interim Year Range: from 2010 to 2020 Ca (Smillions) 06/10 06/11 06/12 06/13 06/14 06/15 106/16 106/17 06/18 06/19 06/20 1,741.16 1,705.62 2.098.26 2.109.34 2.224.70 2.148.93 2,065.97 1,972.38 1,974.69 2,337.03 1,932.17 17.38 16.65 16.47 18.53 48.32 14.17 -3.81 30.43 9.17 22.94 4.67 Operating Revenue Other Revenue Total Revenue Excluding Interest 1,758.54 1,722.27 2.114.73 2,127.87 2,273.02 2,163.10 2,062.16 2,002.86 1,983.86 2,359.97 1,936.84 -1,416.43 -1,382.58 -1,723.96 -1,664.56 -1,727.53 -1,698.25 -1,567.36 -1,532.38 -1,569.29 -1,875.36 -1,515.46 Operating Expenses EBITDA 342.10 339.68 390.77 463.31 545.49 464.85 494.80 470.48 414.56 484.61 421.31 Depreciation Amortisation Depreciation -126.27 -5.28 -131.54 -119.81 -8.60 -128.40 -138.50 -12.67 -151.16 -151.63 -12.64 -164.27 -162.62 -13.94 -176.56 -157.61 -23.02 -180.63 -161.12 -26.69 -187.82 -162.86 -31.43 -194.29 -166.93 -30.27 -197.19 -161.54 -34.41 -195.95 -171.91 -33.64 -205.55 and Amortisation EBIT 210.56 211,28 239.61 299.05 368.92 284.22 306.99 276.19 217.37 288.66 215.83 3.56 0.83 2.36 1.68 5.58 0.89 2.86 1.90 0.92 3.82 0.00 Interest Revenue Interest Expense -49.04 -48.96 -58.42 -55.60 -77.13 -87.66 -99,15 -89,52 -77.96 -70.73 -51.39 -45.48 -48.13 -56.06 -53.91 -71.55 -86.77 -96.29 -87.62 -77.04 -66.91 -51.39 Net Interest Expense 165.08 163.15 183.5S 245.14 297.37 197.45 210.70 188.57 140.33 221.75 164.44 PreTax Profit Tax Expense Net Profit after Tax Before Abnormals -46.62 116.54 -51.10 132.45 -42.12 203.02 -86.42 210.95 -54.90 142.55 -57.20 153.49 -54.29 134.29 -37.60 102.72 -65.95 155.80 -42.98 121.46 121.74 3.93 0.00 -0.51 0.00 16.66 0.00 -23.59 -11.79 7.43 -0.93 -54.01 29.22 -311.76 95.34 10.48 -1.90 -4.67 0.00 0.00 6.69 0.00 0.00 3.93 -0.51 16.66 -35.38 6.50 -24.79 -216.42 8.57 0.00 6.69 -4.67 125.66 116.03 149.11 167.64 217.45 117.76 -62.92 142.86 121.07 329.76 116.79 0.00 0.00 0.00 0.00 0.00 0.00 0.00 0.00 0.00 0.00 0.00 0.00 Abnormals Abnormals Tax Net Abnormals Reported NPAT After Abnormals Outside Equity Interests Shares Outstanding at Period End Weighted Average Number of Shares EPS Adjusted (cents/share) EPS After Abnormals (cents/share) 604.93 695.07 718.67 733.30 733.31 733.36 715.53 715.53 716.29 716.77 718.13 596.29 629.07 706.85 730.01 733.31 725.45 733.35 725.45 715.53 716.08 716.62 717.65 20.42 18.53 18.74 27.81 28.77 19.44 21.16 18.77 14.35 21.74 16.91 21.07 18.44 21.10 22.96 29.65 16.06 -8.67 19.97 16.91 46.02 16.26 Your team has been hired as financial analysts by Meridian Banking Corporation. The bank requires your team to analyse the financial position and performance of the above assigned companies for the two stated financial years (2018 and 2019), to determine whether the companies are eligible for a loan from the bank. Your task involves answering the following 5 questions in your own words (i.e. do not simply "cut and paste information from the Annual Report or any other source). You must apply critical thinking concepts when explaining and justifying your choices. NB: Ensure that you refer to the marking criteria prior to commencing the assignment. BASED ON THE INFORMATION AVAILABLE ON THE DatAnalysis Premium DATABASE FOR BOTH ASSIGNED COMPANIES, ANSWER ALL OF THE FOLLOWING QUESTIONS (1 TO 5 INCLUSIVE). QUESTION 1: Analyse the sources of finance for each of the two companies in 2019 as compared to 2018. Use two capital structure ratios to support your answer and provide an explanation regarding the changes in the composition of the sources of finance for each enterprise. Note: ensure that you analyse in this question, not just describe the ratio values. (2 marks) QUESTION 2: For each of the two companies, analyse their ability to successfully manage each of their categories of expenses in 2019 as compared to 2018. Use three profit margin ratios to support your answer and explain any change in the ability of each company to control costs. Note: ensure that you analyse in this question, not just describe the ratio values. (3 marks) View Annual Interim Year Range: from 2010 to 2020 (smilions) 06/10 06/11 06/12 06/13 06/14 06/15 06/16 06/17 06/18 06/19 06/20 67.39 Current Assets Cash Recevables Prepaid Expenses Inventories Investments NCA Held Sale Other Total Current Assets 0.75 176.59 1.46 47.42 4.03 0.00 0.00 230.25 36.49 185.70 2.30 86.09 1.29 0.00 7.97 319.85 4.61 265.85 9.26 102.67 2.23 0.00 18.98 403.60 286.41 2.53 37.91 6.74 0.00 20.22 421.19 11.15 268.56 2.79 50.18 7.43 1.86 15.80 357.77 3.54 190.37 1.77 56.67 13.28 1.77 30.10 297.50 4.77 189.72 1.91 55.30 20.97 0.95 14.30 287.92 5.71 178.10 2.86 43.81 7.62 0.00 10.48 248.57 2.75 157.75 2.75 32.10 12.84 274.24 9.17 491.61 44.92 183.52 3.82 26.76 12.43 0.00 13.38 41.11 174.72 3.74 52.32 34.57 0.00 2.80 309.26 284.84 Non-Current Assets Receivables Inventories Investments PPHE Intangibles(ExGW) Goodwill Future Tax Benefit Other Total NCA 0.00 0.00 0.00 0.00 0.00 0.00 0.00 0.00 0.00 0.00 0.00 39.83 39.77 40.34 121.30 105.94 87.66 43.86 22.86 21.10 13.30 0.00 10.18 11.50 3.33 4.21 0.93 61.09 83.90 36.19 46.78 86.98 124.26 3,665.35 3,716.22 4,043.22 4,309.66 4.813.68 4,496.19 4,479.93 4,373.33 3,900.76 3,943.80 3,761.56 83.08 123.82 147.22 203.86 288.08 278.02 303.17 305.71 240.30 235.14 212.09 147.82 140.46 142.46 153.31 169.13 161.15 173.52 173.33 164.17 171.10 167.24 0.00 0.00 0.00 0.00 0.00 0.00 0.00 0.00 0.00 0.00 0.00 5.94 5.29 5.95 6.74 10.22 9.74 16.21 10.48 6.42 0.00 0.00 3,952.20 4,037.06 4,382.53 4,799.09 5,387.98 5,093.86 5,100.58 4,921.90 4,379.53 4,450.39 4,265.16 Total Assets 4,182.45 4,356.90 4,786.13 5.220.28 5.745.75 5,391.36 5,388.50 5,170.48 4,871.14 4,735.23 4,574.42 Current Liabilities Account Payable Short-Term Debt Provisions NCL Held Sale Other Total Curr. Liabilities 213.22 2.58 41.51 0.00 0.00 273.83 2.33 40.53 0.00 0.00 320.49 79.80 69.52 0.00 0.00 268.72 565.24 68.23 0.00 0.00 257.41 220.24 102.22 0.00 0.00 189.48 470.16 31.88 0.00 0.00 691.52 212.60 290.78 32.41 0.00 0.00 192.38 367.62 64.76 0.00 0.00 157.75 470.51 32.10 38.52 0.00 698.89 176,83 121.39 78.38 0.00 0.00 376.60 177.52 205.55 85.02 0.00 0.00 257.31 316.68 469.80 902.20 579.87 535,80 624.76 468.09 Non-Current Liabilities Account Payable Long-Term Debt Provisions Other Total NCL 0.00 0.00 0.00 0.00 0.00 0.00 0.00 0.00 0.00 0.00 0.00 1,039.35 835.41 941.22 588.83 982.25 1,079.33 1,326.15 1.086.67 891.50 926.21 913.76 629.13 706.47 698.65 741.30 830.78 793.34 821.81 809.52 773.18 764.67 733.44 0.59 0.38 0.34 8.42 24.16 19.48 13.35 6.67 6.42 8.60 10.28 1,669.07 1,542.26 1,640.21 1,338.56 1,837.19 1,892.16 2,161.31 1,902.86 1,671.10 1,699.48 1,657.48 Total Liabilities 1,926.38 1,858.94 2.110.01 2,240.75 2,417.06 2,583.67 2,697.11 2,527.62 2,369.99 2,076.08 2.125.57 Shareholders Equity Share Capital Reserves Retained Earnings Other Equity Convertible Equity SE Held Sale Outside Equity Total Equity 771.04 1,090.76 1,201.39 1,352.03 1,491.50 1,421.11 1,444.37 1,442.86 1,394.11 1,455.74 1,427.64 -23.62 -24.20 -0.36 12.64 8.36 17.71 13.35 0.00 11.92 -27.72 1,508.66 1,431.41 1,475.10 1,614.86 1,828.83 1,368.87 1,233.67 1,200.00 1,095.11 1,231.12 1,059.52 -38.31 0.00 0.00 0.00 0.00 0.00 0.00 0.00 0.00 0.00 0.00 0.00 0.00 0.00 0.00 0.00 0.00 0.00 0.00 0.00 0.00 0.00 0.00 0.00 0.00 0.00 0.00 0.00 0.00 0.00 0.00 0.00 0.00 0.00 2,256.08 2,497.96 2,676.12 2.979.53 3,328.69 2.807.69 2,691.39 2,642.86 2,501.15 2,659.15 2,448.85 View: Annual Interim Year Range: from 2010 to 2020 Ca (Smillions) 06/10 06/11 06/12 06/13 06/14 06/15 106/16 106/17 06/18 06/19 06/20 1,741.16 1,705.62 2.098.26 2.109.34 2.224.70 2.148.93 2,065.97 1,972.38 1,974.69 2,337.03 1,932.17 17.38 16.65 16.47 18.53 48.32 14.17 -3.81 30.43 9.17 22.94 4.67 Operating Revenue Other Revenue Total Revenue Excluding Interest 1,758.54 1,722.27 2.114.73 2,127.87 2,273.02 2,163.10 2,062.16 2,002.86 1,983.86 2,359.97 1,936.84 -1,416.43 -1,382.58 -1,723.96 -1,664.56 -1,727.53 -1,698.25 -1,567.36 -1,532.38 -1,569.29 -1,875.36 -1,515.46 Operating Expenses EBITDA 342.10 339.68 390.77 463.31 545.49 464.85 494.80 470.48 414.56 484.61 421.31 Depreciation Amortisation Depreciation -126.27 -5.28 -131.54 -119.81 -8.60 -128.40 -138.50 -12.67 -151.16 -151.63 -12.64 -164.27 -162.62 -13.94 -176.56 -157.61 -23.02 -180.63 -161.12 -26.69 -187.82 -162.86 -31.43 -194.29 -166.93 -30.27 -197.19 -161.54 -34.41 -195.95 -171.91 -33.64 -205.55 and Amortisation EBIT 210.56 211,28 239.61 299.05 368.92 284.22 306.99 276.19 217.37 288.66 215.83 3.56 0.83 2.36 1.68 5.58 0.89 2.86 1.90 0.92 3.82 0.00 Interest Revenue Interest Expense -49.04 -48.96 -58.42 -55.60 -77.13 -87.66 -99,15 -89,52 -77.96 -70.73 -51.39 -45.48 -48.13 -56.06 -53.91 -71.55 -86.77 -96.29 -87.62 -77.04 -66.91 -51.39 Net Interest Expense 165.08 163.15 183.5S 245.14 297.37 197.45 210.70 188.57 140.33 221.75 164.44 PreTax Profit Tax Expense Net Profit after Tax Before Abnormals -46.62 116.54 -51.10 132.45 -42.12 203.02 -86.42 210.95 -54.90 142.55 -57.20 153.49 -54.29 134.29 -37.60 102.72 -65.95 155.80 -42.98 121.46 121.74 3.93 0.00 -0.51 0.00 16.66 0.00 -23.59 -11.79 7.43 -0.93 -54.01 29.22 -311.76 95.34 10.48 -1.90 -4.67 0.00 0.00 6.69 0.00 0.00 3.93 -0.51 16.66 -35.38 6.50 -24.79 -216.42 8.57 0.00 6.69 -4.67 125.66 116.03 149.11 167.64 217.45 117.76 -62.92 142.86 121.07 329.76 116.79 0.00 0.00 0.00 0.00 0.00 0.00 0.00 0.00 0.00 0.00 0.00 0.00 Abnormals Abnormals Tax Net Abnormals Reported NPAT After Abnormals Outside Equity Interests Shares Outstanding at Period End Weighted Average Number of Shares EPS Adjusted (cents/share) EPS After Abnormals (cents/share) 604.93 695.07 718.67 733.30 733.31 733.36 715.53 715.53 716.29 716.77 718.13 596.29 629.07 706.85 730.01 733.31 725.45 733.35 725.45 715.53 716.08 716.62 717.65 20.42 18.53 18.74 27.81 28.77 19.44 21.16 18.77 14.35 21.74 16.91 21.07 18.44 21.10 22.96 29.65 16.06 -8.67 19.97 16.91 46.02 16.26
Step by Step Solution
There are 3 Steps involved in it

Get step-by-step solutions from verified subject matter experts