

Question: can you just explain how to solve, dont need the answers to the problem just need to learn how i would have to plug the
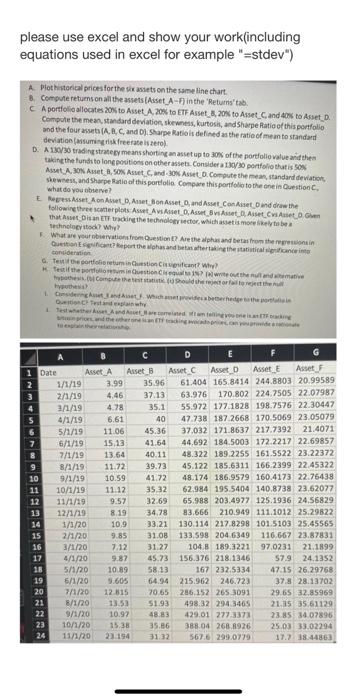
please use excel and show your work(including equations used in excel for example "=stdev") A Plot historical prices for the seases on the same line chart 8. Compute returns on all the assets Asset A-n in the 'Returns'tab CA portfolio allocates 20% to Asset A 20% to ETF Asset ,20% to Asset_and to Asset Compute the mean, standard deviation skewnes, kurtos, and Sharpe Ratio of this portfolio and the four (A.B.Cand Dj Sharpe Ratio is defined as the ratio of mean to standard deviation assuming freeratesser D. A 130/30 trading strategy meansshorting an asetup to 30 of the portfolio value and then taking the funds to long positions on other assets. Considerat portfolio that is on AMLA BONA SOX Asset Cand-30% Auto.compute the mean, standard deviation, shewness, and Sharpe Ratio of this portfolio Compare this portfolio to the one in Question what do you serve? E AS A ont BA Bon Asset and Asset_Constand draw the following the strplots Atlet Asset Aset Cosset. that is Trading the technolovector, which assets more to be technology tod? Why? What are your brain from Gestion? Are the alpha and bets from the Geport the hand better taking the statistical contention Teleortfoliorum instinct vocant? Why? Kesif the rootinuestion is in write them and what recome the best oudsherred the hes Cercant which were the Testade Tester Andrewniane pp B D G 1 Date Asset A Asset B Asset Asset D Asset Asset 1/1/19 3.99 35.96 61.404 165.8414 244.8803 20.99589 2/1/19 4.46 37.13 63.976 170.802 224.7505 22.07987 4 2/1/19 4.78 35.1 55.972 177.1828 198.7576 22.30447 5 4/1/19 6.61 40 47.738 187 2668 170.5069 23.05079 5/1/19 11.06 45.36 37.032 171.8637 217.7392 21.4071 6/1/19 15,13 41.64 44.692 184,5003 172.2217 22.69857 7/1/19 13.64 40.11 48.322 189.2255 161.5522 23.22372 9 8/1/19 11.72 39.73 45.122 185.6311 166 2399 22.45322 10 9/1/19 10.59 41.72 48.174 186.9579 160.4173 22.75438 11 10/1/19 11.12 3532 62.984 195.5404 140.8738 23,62077 12 11/1/19 9.57 32.69 65.988 203.4977 125.1936 24,56829 13 12/1/19 8.19 34.78 83.666 210.949 111.1012 25.29822 14 1/1/20 10.9 33.21 130.114 217.8298 101.5103 25.45565 15 2/1/20 9.85 31.08 133,598 204.6349 116.667 23.87831 16 3/1/20 7.12 31.27 104.8 189.3221 97.0231 21.1899 17 4/1/20 9.87 45.73 156.376 218.1346 57.9 24.1352 18 5/1/20 10.89 58.13 167 232.5334 47.15 26.29758 19 6/1/20 5.605 64.94 215.962 246.723 37.8 28.13702 20 7/1/20 12815 70.65 286.152 265 3091 29.65 32.85969 21 8/1/20 13.53 51.93 498.32 294 3465 21.35 3561129 22 9/1/20 10.92 48.83 429.01 277-3373 2385 34.07896 23 10/21/20 15.38 35.86 388.04 268.8926 25.03 33.02294 24 11/1/20 23194 31 32 567.6 299.0779 17.2 18.44863 please use excel and show your work(including equations used in excel for example "=stdev") A Plot historical prices for the seases on the same line chart 8. Compute returns on all the assets Asset A-n in the 'Returns'tab CA portfolio allocates 20% to Asset A 20% to ETF Asset ,20% to Asset_and to Asset Compute the mean, standard deviation skewnes, kurtos, and Sharpe Ratio of this portfolio and the four (A.B.Cand Dj Sharpe Ratio is defined as the ratio of mean to standard deviation assuming freeratesser D. A 130/30 trading strategy meansshorting an asetup to 30 of the portfolio value and then taking the funds to long positions on other assets. Considerat portfolio that is on AMLA BONA SOX Asset Cand-30% Auto.compute the mean, standard deviation, shewness, and Sharpe Ratio of this portfolio Compare this portfolio to the one in Question what do you serve? E AS A ont BA Bon Asset and Asset_Constand draw the following the strplots Atlet Asset Aset Cosset. that is Trading the technolovector, which assets more to be technology tod? Why? What are your brain from Gestion? Are the alpha and bets from the Geport the hand better taking the statistical contention Teleortfoliorum instinct vocant? Why? Kesif the rootinuestion is in write them and what recome the best oudsherred the hes Cercant which were the Testade Tester Andrewniane pp B D G 1 Date Asset A Asset B Asset Asset D Asset Asset 1/1/19 3.99 35.96 61.404 165.8414 244.8803 20.99589 2/1/19 4.46 37.13 63.976 170.802 224.7505 22.07987 4 2/1/19 4.78 35.1 55.972 177.1828 198.7576 22.30447 5 4/1/19 6.61 40 47.738 187 2668 170.5069 23.05079 5/1/19 11.06 45.36 37.032 171.8637 217.7392 21.4071 6/1/19 15,13 41.64 44.692 184,5003 172.2217 22.69857 7/1/19 13.64 40.11 48.322 189.2255 161.5522 23.22372 9 8/1/19 11.72 39.73 45.122 185.6311 166 2399 22.45322 10 9/1/19 10.59 41.72 48.174 186.9579 160.4173 22.75438 11 10/1/19 11.12 3532 62.984 195.5404 140.8738 23,62077 12 11/1/19 9.57 32.69 65.988 203.4977 125.1936 24,56829 13 12/1/19 8.19 34.78 83.666 210.949 111.1012 25.29822 14 1/1/20 10.9 33.21 130.114 217.8298 101.5103 25.45565 15 2/1/20 9.85 31.08 133,598 204.6349 116.667 23.87831 16 3/1/20 7.12 31.27 104.8 189.3221 97.0231 21.1899 17 4/1/20 9.87 45.73 156.376 218.1346 57.9 24.1352 18 5/1/20 10.89 58.13 167 232.5334 47.15 26.29758 19 6/1/20 5.605 64.94 215.962 246.723 37.8 28.13702 20 7/1/20 12815 70.65 286.152 265 3091 29.65 32.85969 21 8/1/20 13.53 51.93 498.32 294 3465 21.35 3561129 22 9/1/20 10.92 48.83 429.01 277-3373 2385 34.07896 23 10/21/20 15.38 35.86 388.04 268.8926 25.03 33.02294 24 11/1/20 23194 31 32 567.6 299.0779 17.2 18.44863
Step by Step Solution
There are 3 Steps involved in it

Get step-by-step solutions from verified subject matter experts