

Question: Can you please answer a and b? Can you please show me the solution step by step in excel sheet? Thank you. For this assignment,
 Can you please answer a and b?
Can you please show me the solution step by step in excel sheet?
Thank you.
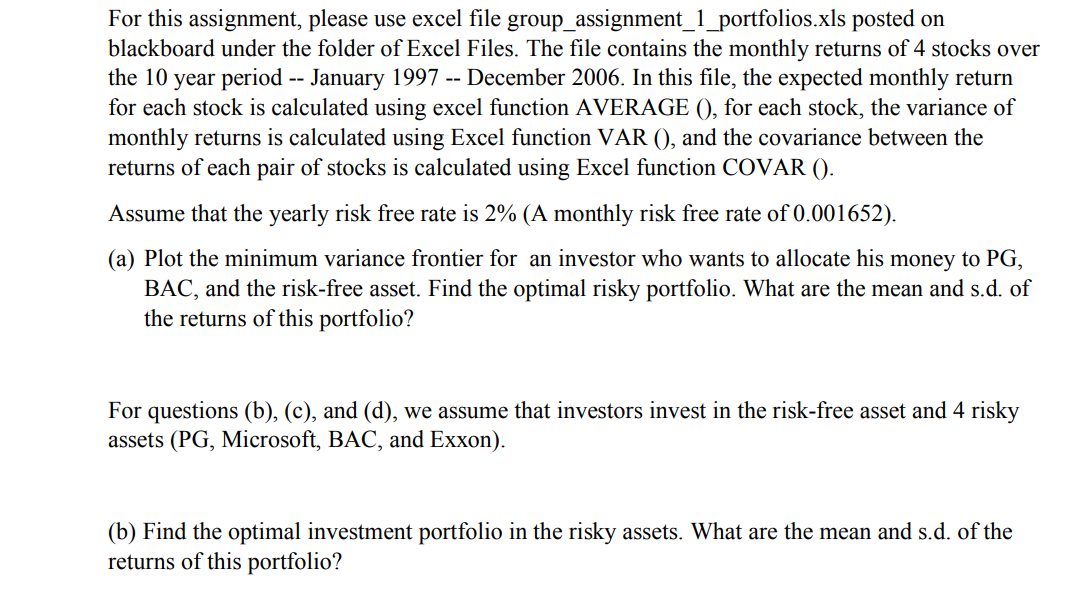
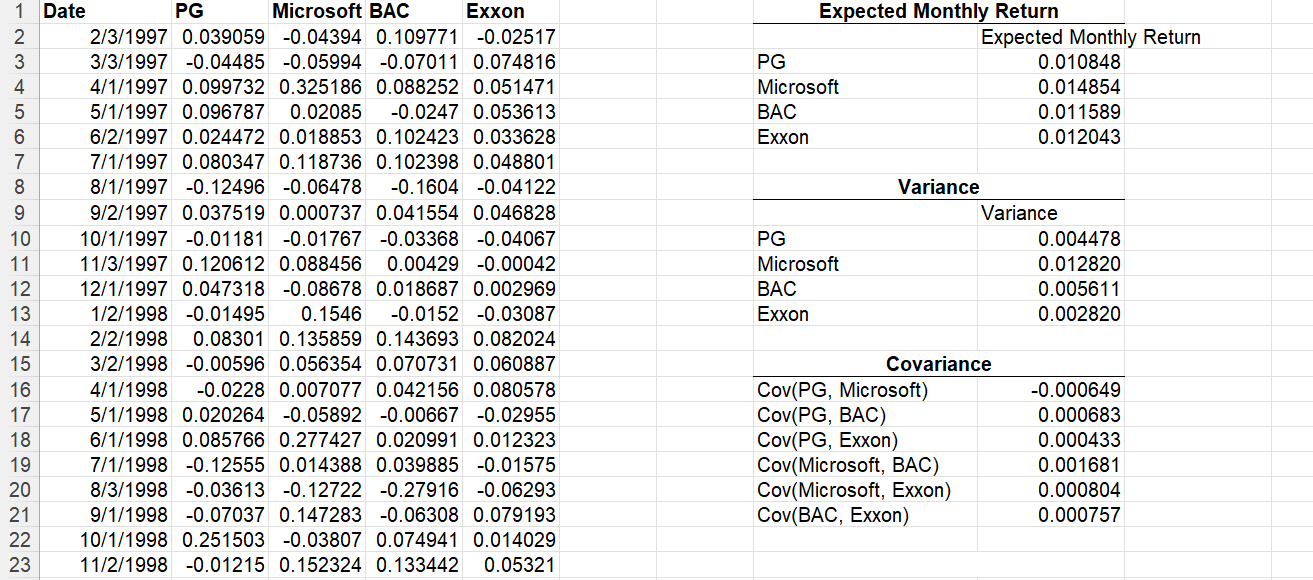
For this assignment, please use excel file group_assignment_1_portfolios.xls posted on blackboard under the folder of Excel Files. The file contains the monthly returns of 4 stocks over the 10 year period -- January 1997 -- December 2006. In this file, the expected monthly return for each stock is calculated using excel function AVERAGE (), for each stock, the variance of monthly returns is calculated using Excel function VAR (), and the covariance between the returns of each pair of stocks is calculated using Excel function COVAR (). Assume that the yearly risk free rate is 2% (A monthly risk free rate of 0.001652). (a) Plot the minimum variance frontier for an investor who wants to allocate his money to PG, BAC, and the risk-free asset. Find the optimal risky portfolio. What are the mean and s.d. of the returns of this portfolio? For questions (b), (c), and (d), we assume that investors invest in the risk-free asset and 4 risky assets (PG, Microsoft, BAC, and Exxon). (b) Find the optimal investment portfolio in the risky assets. What are the mean and s.d. of the returns of this portfolio? NO Expected Monthly Return Expected Monthly Return PG 0.010848 Microsoft 0.014854 BAC 0.011589 Exxon 0.012043 INC 0 0 1 Date PG Microsoft BAC Exxon 2 2/3/1997 0.039059 -0.04394 0.109771 -0.02517 3 3/3/1997 -0.04485 -0.05994 -0.07011 0.074816 4/1/1997 0.099732 0.325186 0.088252 0.051471 5 5/1/1997 0.096787 0.02085 -0.0247 0.053613 6 6/2/1997 0.024472 0.018853 0.102423 0.033628 7 7/1/1997 0.080347 0.118736 0.102398 0.048801 8/1/1997 -0.12496 -0.06478 -0.1604 -0.04122 9 9/2/1997 0.037519 0.000737 0.041554 0.046828 10 10/1/1997 -0.01181 -0.01767 -0.03368 -0.04067 11 11/3/1997 0.120612 0.088456 0.00429 -0.00042 12 12/1/1997 0.047318 -0.08678 0.018687 0.002969 13 1/2/1998 -0.01495 0.1546 -0.0152 -0.03087 14 2/2/1998 0.08301 0.135859 0.143693 0.082024 15 3/2/1998 -0.00596 0.056354 0.070731 0.060887 16 4/1/1998 -0.0228 0.007077 0.042156 0.080578 17 5/1/1998 0.020264 -0.05892 -0.00667 -0.02955 18 6/1/1998 0.085766 0.277427 0.020991 0.012323 19 7/1/1998 -0.12555 0.014388 0.039885 -0.01575 20 8/3/1998 -0.03613 -0.12722 -0.27916 -0.06293 21 9/1/1998 -0.07037 0.147283 -0.06308 0.079193 22 10/1/1998 0.251503 -0.03807 0.074941 0.014029 23 11/2/1998 -0.01215 0.152324 0.133442 0.05321 PG Microsoft BAC Exxon Variance Variance 0.004478 0.012820 0.005611 0.002820 Covariance Cov(PG, Microsoft) Cov(PG, BAC) Cov(PG, Exxon) Cov(Microsoft, BAC) Cov(Microsoft, Exxon) Cov(BAC, Exxon) -0.000649 0.000683 0.000433 0.001681 0.000804 0.000757 For this assignment, please use excel file group_assignment_1_portfolios.xls posted on blackboard under the folder of Excel Files. The file contains the monthly returns of 4 stocks over the 10 year period -- January 1997 -- December 2006. In this file, the expected monthly return for each stock is calculated using excel function AVERAGE (), for each stock, the variance of monthly returns is calculated using Excel function VAR (), and the covariance between the returns of each pair of stocks is calculated using Excel function COVAR (). Assume that the yearly risk free rate is 2% (A monthly risk free rate of 0.001652). (a) Plot the minimum variance frontier for an investor who wants to allocate his money to PG, BAC, and the risk-free asset. Find the optimal risky portfolio. What are the mean and s.d. of the returns of this portfolio? For questions (b), (c), and (d), we assume that investors invest in the risk-free asset and 4 risky assets (PG, Microsoft, BAC, and Exxon). (b) Find the optimal investment portfolio in the risky assets. What are the mean and s.d. of the returns of this portfolio? NO Expected Monthly Return Expected Monthly Return PG 0.010848 Microsoft 0.014854 BAC 0.011589 Exxon 0.012043 INC 0 0 1 Date PG Microsoft BAC Exxon 2 2/3/1997 0.039059 -0.04394 0.109771 -0.02517 3 3/3/1997 -0.04485 -0.05994 -0.07011 0.074816 4/1/1997 0.099732 0.325186 0.088252 0.051471 5 5/1/1997 0.096787 0.02085 -0.0247 0.053613 6 6/2/1997 0.024472 0.018853 0.102423 0.033628 7 7/1/1997 0.080347 0.118736 0.102398 0.048801 8/1/1997 -0.12496 -0.06478 -0.1604 -0.04122 9 9/2/1997 0.037519 0.000737 0.041554 0.046828 10 10/1/1997 -0.01181 -0.01767 -0.03368 -0.04067 11 11/3/1997 0.120612 0.088456 0.00429 -0.00042 12 12/1/1997 0.047318 -0.08678 0.018687 0.002969 13 1/2/1998 -0.01495 0.1546 -0.0152 -0.03087 14 2/2/1998 0.08301 0.135859 0.143693 0.082024 15 3/2/1998 -0.00596 0.056354 0.070731 0.060887 16 4/1/1998 -0.0228 0.007077 0.042156 0.080578 17 5/1/1998 0.020264 -0.05892 -0.00667 -0.02955 18 6/1/1998 0.085766 0.277427 0.020991 0.012323 19 7/1/1998 -0.12555 0.014388 0.039885 -0.01575 20 8/3/1998 -0.03613 -0.12722 -0.27916 -0.06293 21 9/1/1998 -0.07037 0.147283 -0.06308 0.079193 22 10/1/1998 0.251503 -0.03807 0.074941 0.014029 23 11/2/1998 -0.01215 0.152324 0.133442 0.05321 PG Microsoft BAC Exxon Variance Variance 0.004478 0.012820 0.005611 0.002820 Covariance Cov(PG, Microsoft) Cov(PG, BAC) Cov(PG, Exxon) Cov(Microsoft, BAC) Cov(Microsoft, Exxon) Cov(BAC, Exxon) -0.000649 0.000683 0.000433 0.001681 0.000804 0.000757
Step by Step Solution
There are 3 Steps involved in it

Get step-by-step solutions from verified subject matter experts