

Question: can you please answer question 3rd? 2. Piot 1/ ( y-axis) vs 1in2(x-axis) for hydrogen and eltach vour araph is the byox of this bandout,
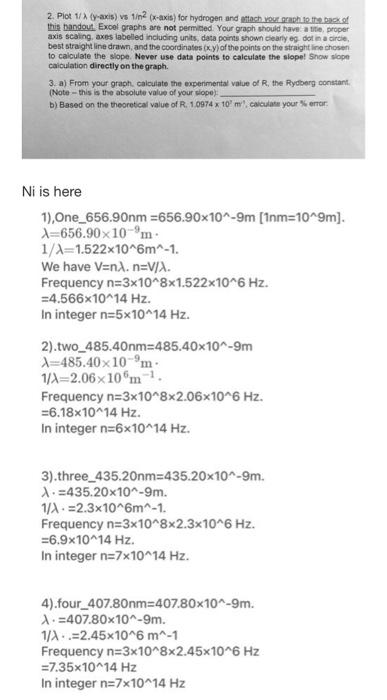
2. Piot 1/ ( y-axis) vs 1in2(x-axis) for hydrogen and eltach vour araph is the byox of this bandout, Excel graphs are not permicled. Your graph should have: a tifle, proper axis scaling, axes labelled incluoing units, data points shown chearly eg. dot in a clicie, best straight line drawn, and the coordinates y y of the points on the straight line chosen to calculate the slope. Never use data points to calculate the slopel Snow slope caiculation directly on the graph. 3. a) From your graph, calculate the experimental value of R, the Rydoory constant. (Note - this is the absolute value of your slope). b) Based on the theoretical value of R,1.097410m. caculate your \% entr: is here 2. Piot 1/ ( y-axis) vs 1in2(x-axis) for hydrogen and eltach vour araph is the byox of this bandout, Excel graphs are not permicled. Your graph should have: a tifle, proper axis scaling, axes labelled incluoing units, data points shown chearly eg. dot in a clicie, best straight line drawn, and the coordinates y y of the points on the straight line chosen to calculate the slope. Never use data points to calculate the slopel Snow slope caiculation directly on the graph. 3. a) From your graph, calculate the experimental value of R, the Rydoory constant. (Note - this is the absolute value of your slope). b) Based on the theoretical value of R,1.097410m. caculate your \% entr: is here
Step by Step Solution
There are 3 Steps involved in it

Get step-by-step solutions from verified subject matter experts