

Question: can you please do the graph as well. PR 20-6A Contribution Margin, Break-Even Sales, Cost-Volume-Profit Chart, Margin of Safety, and Operating Leverage Obj. 2. 3.
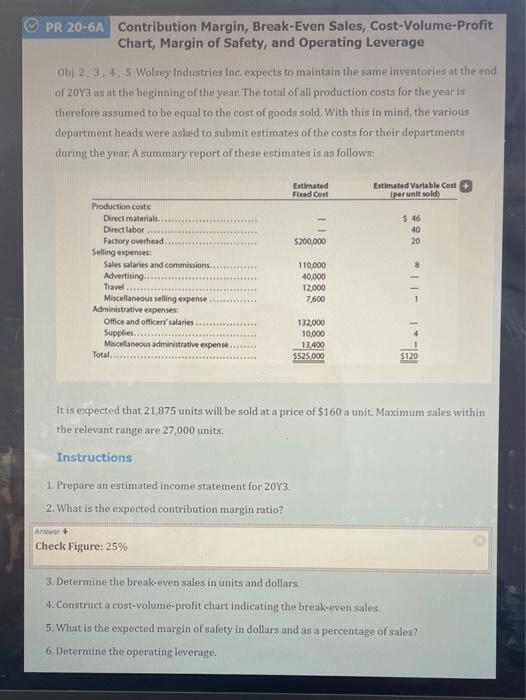
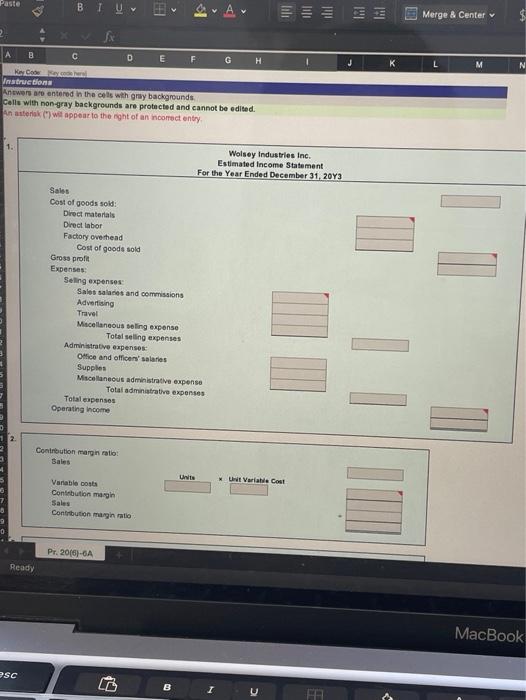
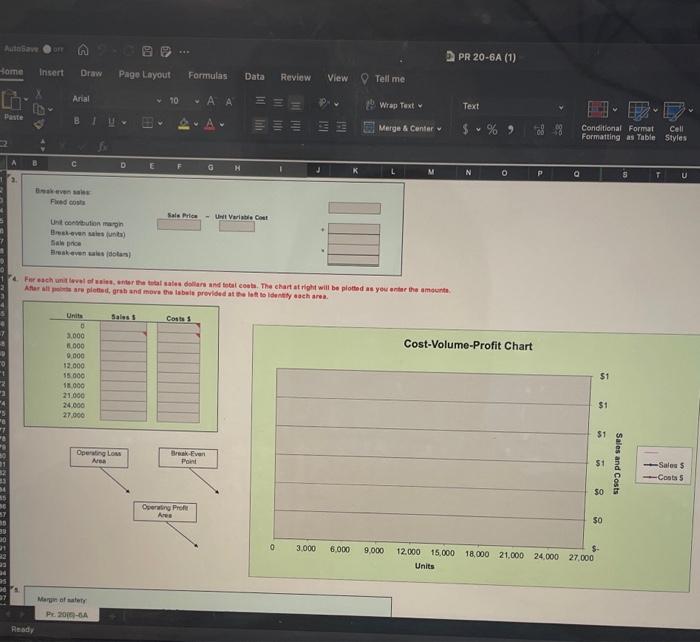
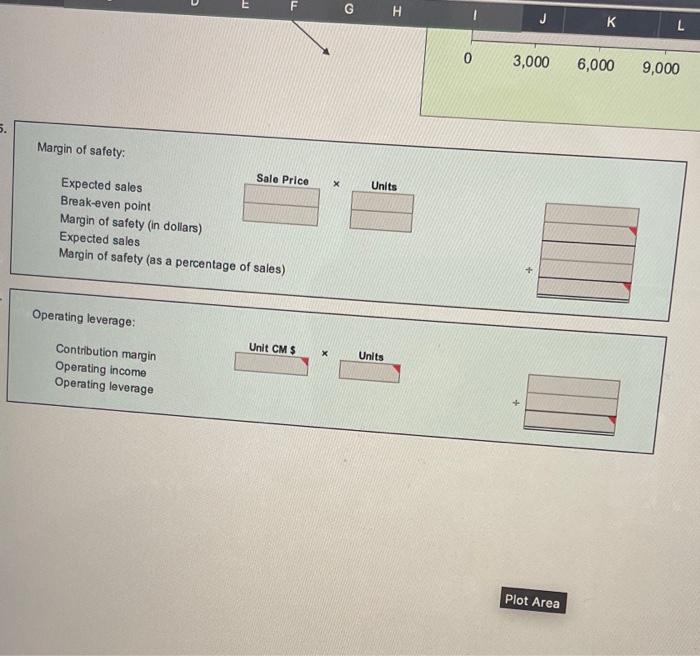
PR 20-6A Contribution Margin, Break-Even Sales, Cost-Volume-Profit Chart, Margin of Safety, and Operating Leverage Obj. 2. 3. 4. 5 Wolsey Industries Inc. expects to maintain the same inventories at the end of 2093 as at the beginning of the year. The total of all production costs for the year is therefore assumed to be equal to the cost of goods sold. With this in mind, the various department heads were asked to submit estimates of the costs for their departments during the year. A summary report of these estimates is as follows: Estimated Fixed cost Estimated Variable Cost Iperunit sold) 5 46 40 20 $200,000 Production costs Direct materials. Direct labor Factory overhead Selling expenses Sales salaries and commissions Advertising Travel Miscellaneous selling expense. Administrative expenses Office and officers' salaries Supplies Miscellaneous administrative expense Total -Il. 888 110,000 40,000 12000 7,600 132,000 10,000 13.400 $525.000 L. $120 It is expected that 21,875 units will be sold at a price of $160 a unit. Maximum sales within the relevant range are 27,000 units. Instructions 1. Prepare an estimated income statement for 20Y3 2. What is the expected contribution margin ratio? Antwer Check Figure: 25% 3. Determine the break-even sales in units and dollars 4. Construct a cost-volume-profit chart indicating the break-even sales. 5. What is the expected margin of safety in dollars and as a percentage of sales? 6. Determine the operating leverage. Paste BIU DO lili Merge & Center 2 M N B C D E F G H Code natructions Answers are entered in the cells with gray backgrounds Calls with non-gray backgrounds are protected and cannot be edited. An sterk wit appear to the night of an incorrect entry 1. Wolsey Industries Inc. Estimated Income Statement For the Year Ended December 31, 2023 Sales Cost of goods sold: Direct materials Direct labor Factory overhead Cost of goods sold Gross profit Expenses Selling expenses Salossaries and commissions Advertising Travel Miscellaneousseling expense Total selling expenses Administrative expenses Office and officers' salaries Supplies Miscellaneous administrative expense Total administrative expenses Total expenses Operating income Contribution margin to Bales Units UNE Variable Cost Variable sota Contibution margin Sales Contribution marginato Pr. 2006)-6A Ready MacBook PSC D B Bu bave PR 20-6A (1) Home Insert Draw Page Layout Formulas Data Review View Tell me Arial 10 -AA P. IS Text Wrap Text Daste Marge & Center $ % 9 Conditional Format Cell Formatting as Table Styles A B D F G M Q T U even Fred Sale Price - UNIVwbie Cat Untution margin Brestovanie Breskvada Forschunilevel of the total sat dollars and total cost The chart at right will be plotted as you are the amount Atalar pletters and move the table provided at the last to let each area Costas Cost-Volume-Profit Chart Units 0 3,000 1000 9.000 12.000 15.000 000 21.000 24.000 27.000 $1 $1 31 Operating Low Area Break Even Point 51 Sales and Costs Sale $ Costas so Overwing Profile Ares $0 0 3,000 6.000 9.000 12.000 15.000 18,000 21.000 24.000 27.000 Units Mer of any PE 200-GA Ready G H K L 0 3,000 6,000 9,000 X Units Margin of safety: Sale Price Expected sales Break-even point Margin of safety (in dollars) Expected sales Margin of safety (as a percentage of sales) Operating leverage: Unit CMS X Units Contribution margin Operating income Operating leverage Plot Area
Step by Step Solution
There are 3 Steps involved in it

Get step-by-step solutions from verified subject matter experts