

Question: Can you please explain using excel. Please show how I would be able to enter into excel myself. Thank you 2. Starting with $100,000 (INPUT
Can you please explain using excel. Please show how I would be able to enter into excel myself. Thank you
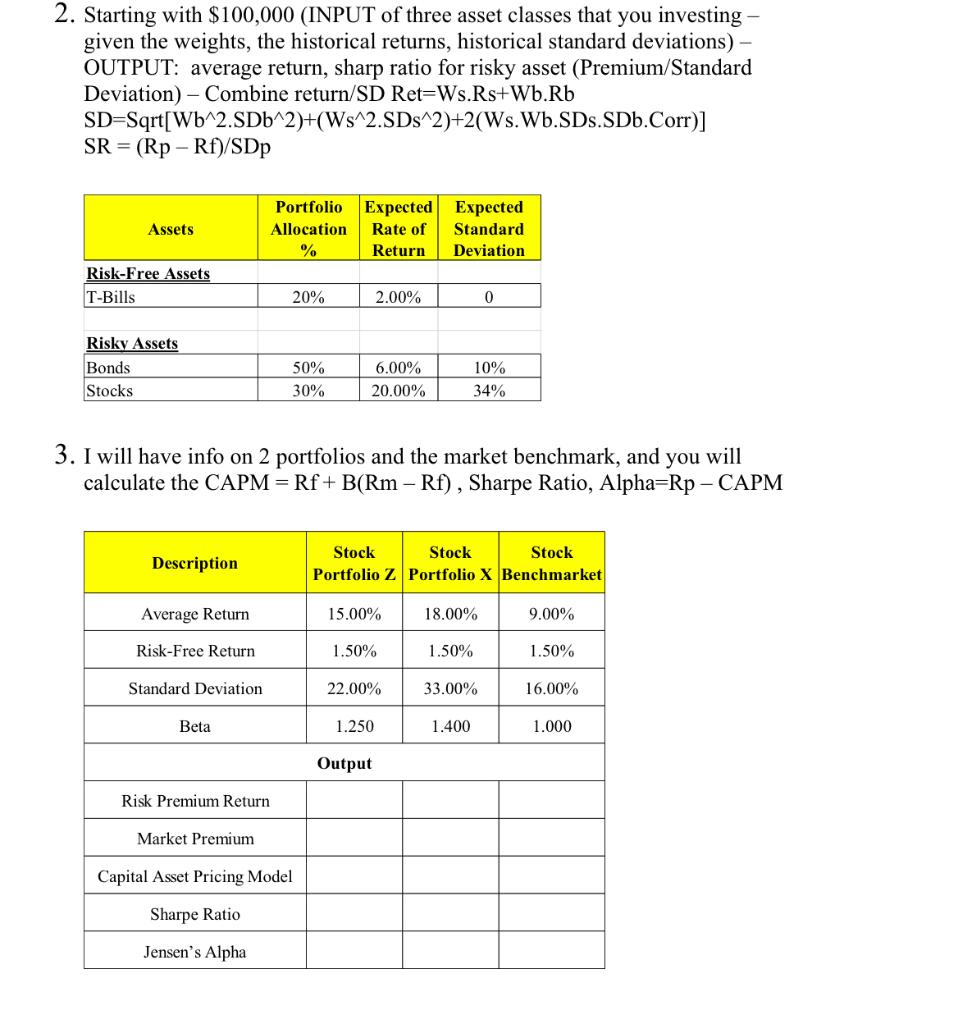
2. Starting with $100,000 (INPUT of three asset classes that you investing given the weights, the historical returns, historical standard deviations) - OUTPUT: average return, sharp ratio for risky asset (Premium/Standard Deviation) - Combine return/SD Ret=Ws.Rs+Wb.Rb SD=Sqrt[Wb^2.SDb^2)+(Ws^2.SDs^2)+2(Ws.Wb.SDs.SDb.Corr)] SR = (Rp - Rf)/SDp Assets Portfolio Allocation % Expected Expected Rate of Standard Return Deviation Risk-Free Assets T-Bills 20% 2.00% 0 Risky Assets Bonds Stocks 50% 30% 6.00% 20.00% 10% 34% 3. I will have info on 2 portfolios and the market benchmark, and you will calculate the CAPM=Rf+B(Rm - Rf), Sharpe Ratio, Alpha=Rp - CAPM Description Stock Stock Stock Portfolio 2 Portfolio X Benchmarket Average Return 15.00% 18.00% 9.00% Risk-Free Return 1.50% 1.50% 1.50% Standard Deviation 22.00% 33.00% 16.00% Beta 1.250 1.400 1.000 Output Risk Premium Return Market Premium Capital Asset Pricing Model Sharpe Ratio Jensen's Alpha 2. Starting with $100,000 (INPUT of three asset classes that you investing given the weights, the historical returns, historical standard deviations) - OUTPUT: average return, sharp ratio for risky asset (Premium/Standard Deviation) - Combine return/SD Ret=Ws.Rs+Wb.Rb SD=Sqrt[Wb^2.SDb^2)+(Ws^2.SDs^2)+2(Ws.Wb.SDs.SDb.Corr)] SR = (Rp - Rf)/SDp Assets Portfolio Allocation % Expected Expected Rate of Standard Return Deviation Risk-Free Assets T-Bills 20% 2.00% 0 Risky Assets Bonds Stocks 50% 30% 6.00% 20.00% 10% 34% 3. I will have info on 2 portfolios and the market benchmark, and you will calculate the CAPM=Rf+B(Rm - Rf), Sharpe Ratio, Alpha=Rp - CAPM Description Stock Stock Stock Portfolio 2 Portfolio X Benchmarket Average Return 15.00% 18.00% 9.00% Risk-Free Return 1.50% 1.50% 1.50% Standard Deviation 22.00% 33.00% 16.00% Beta 1.250 1.400 1.000 Output Risk Premium Return Market Premium Capital Asset Pricing Model Sharpe Ratio Jensen's Alpha
Step by Step Solution
There are 3 Steps involved in it

Get step-by-step solutions from verified subject matter experts