

Question: Can you please help me graph the presented data please? 1. Plot the data below in the grid of squares provided. You will have two
Can you please help me graph the presented data please?
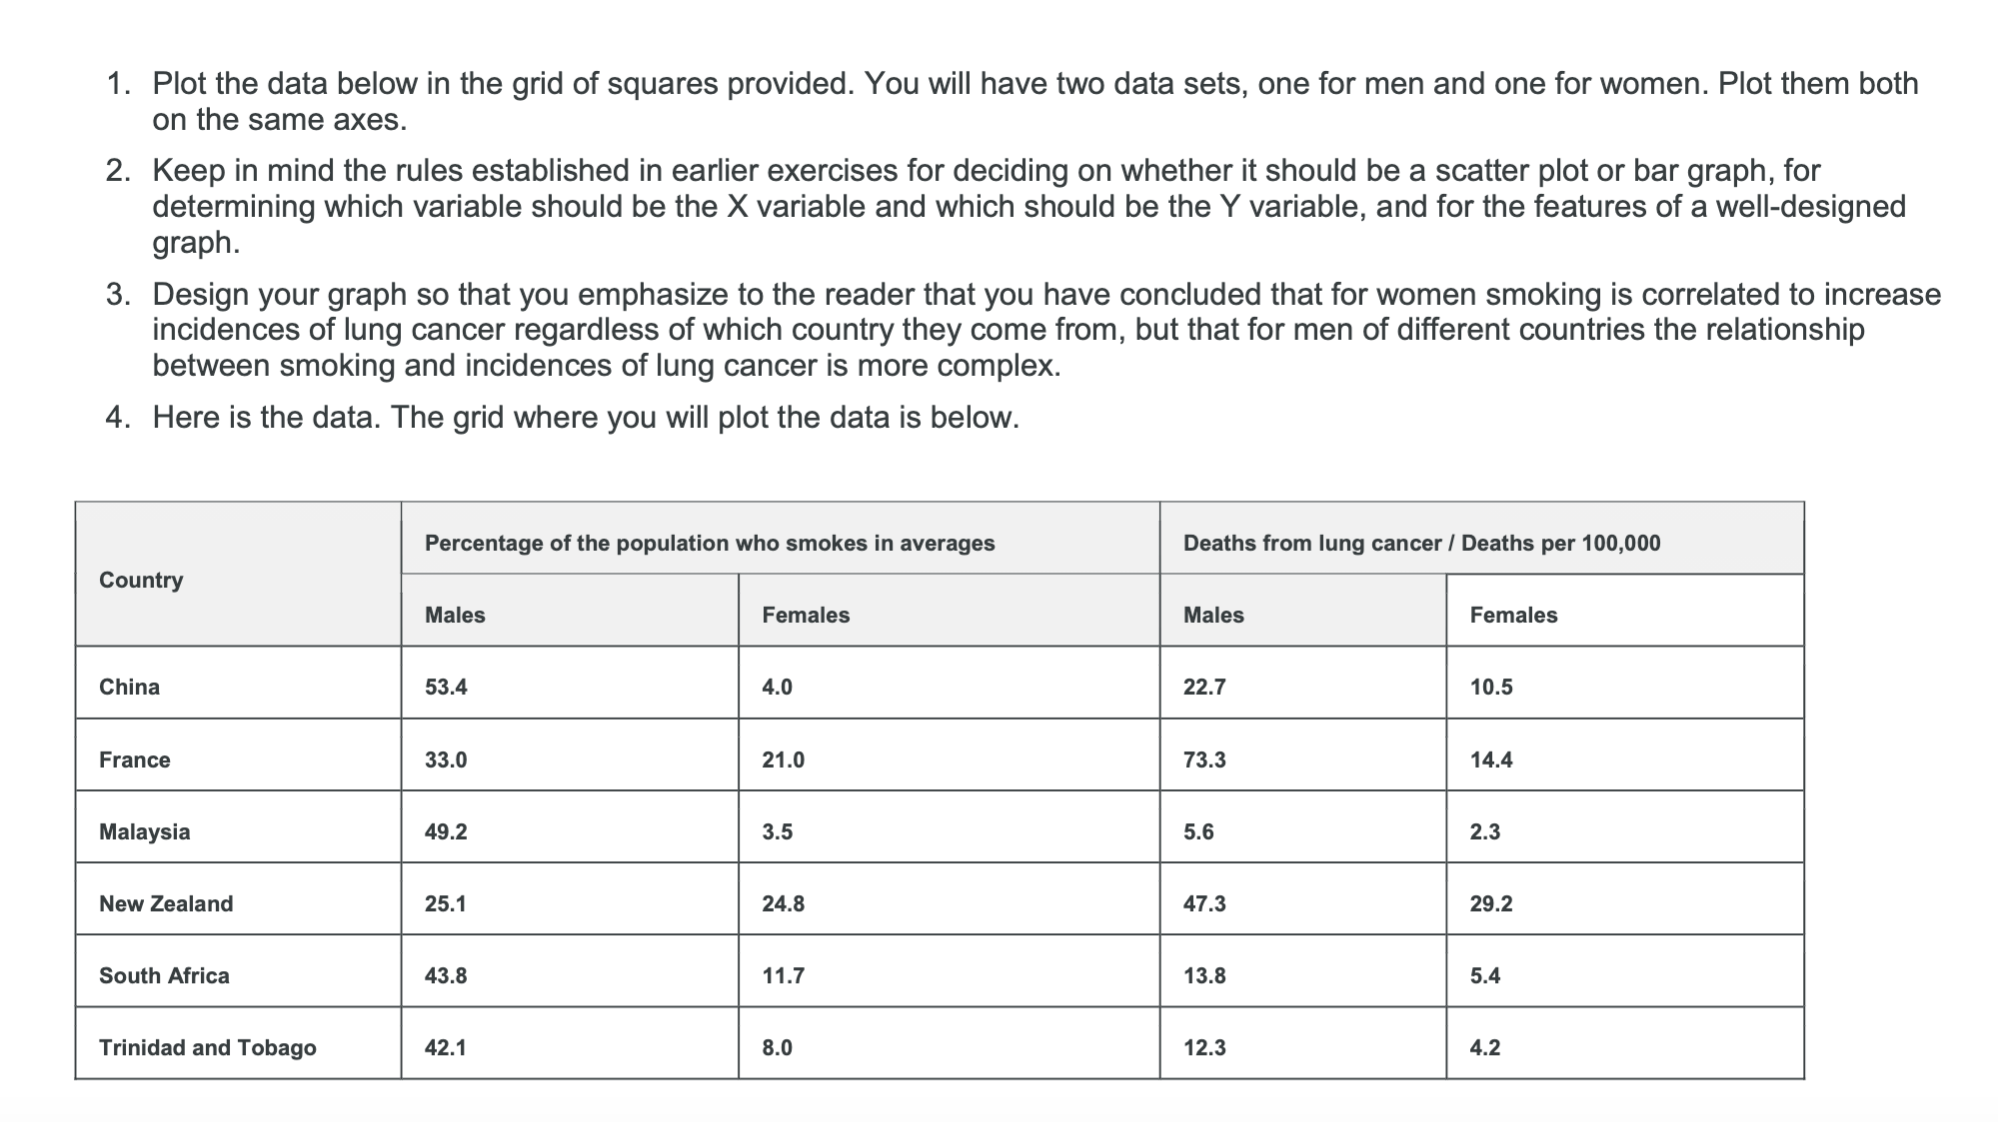
1. Plot the data below in the grid of squares provided. You will have two data sets, one for men and one for women. Plot them both on the same axes. 2. Keep in mind the rules established in earlier exercises for deciding on whether it should be a scatter plot or bar graph, for determining which variable should be the X variable and which should be the Y variable, and for the features of a well-designed graph. 3. Design your graph so that you emphasize to the reader that you have concluded that for women smoking is correlated to increase incidences of lung cancer regardless of which country they come from. but that for men of different countries the relationship between smoking and incidences of lung cancer is more complex. 4. Here is the data. The grid where you will plot the data is below. Percentage of the population who smokss In averages Deaths from lung cancer! Deaths per 100,000 53.4 France Malaysia South Africa 11.7 Trinidad and Tobago
Step by Step Solution
There are 3 Steps involved in it

Get step-by-step solutions from verified subject matter experts