

Question: Can you please help me make a decision for TQM on CAPSIM, would it be wise to input 1500 in CPI, Vendor, and CCE? Draft
Can you please help me make a decision for TQM on CAPSIM, would it be wise to input 1500 in CPI, Vendor, and CCE?
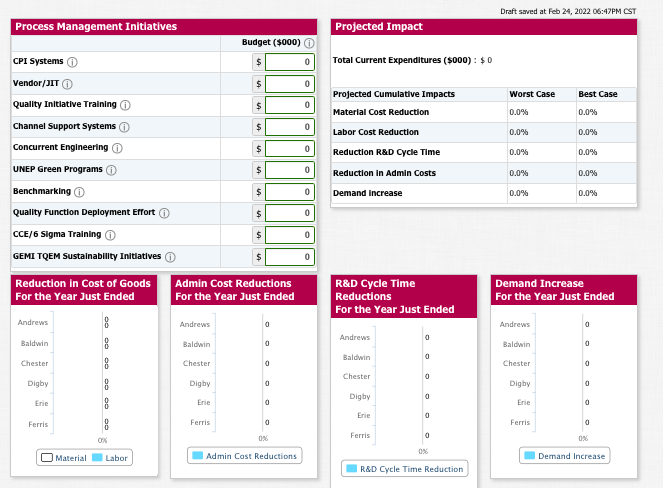
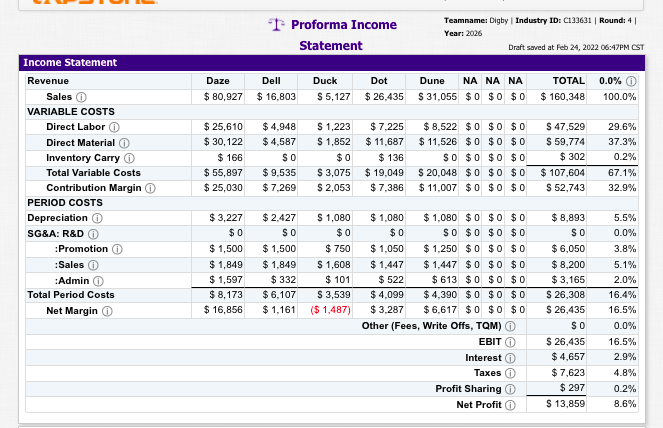
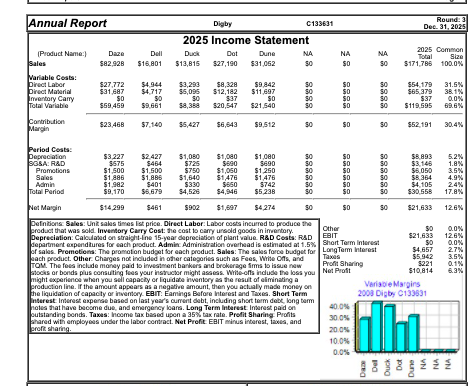
Draft saved at Feb 24, 2022 06:47PM CST Process Management Initiatives Projected Impact Budget ($000) CPI Systems $ 0 Total Current Expenditures ($000): $0 Vendor/JIT $ 0 Best Case Quality Initiative Training $ 0 Worst Case 0.0% 0.0% Channel Support Systems $ 0 Projected Cumulative Impacts Material Cost Reduction Labor Cost Reduction Reduction R&D Cycle Time Reduction in Admin Costs 0.0% 0.0% Concurrent Engineering $ 0 0.0% 0.0% UNEP Green Programs $ 0 0.0% 0.0% $ 0 Demand increase 0.0% 0.0% $ 0 $ 0 Benchmarking Quality Function Deployment Effort CCE/6 Sigma Training GEMI TQEM Sustainability Initiatives Reduction in Cost of Goods For the Year Just Ended 0 Admin Cost Reductions For the Year Just Ended R&D Cycle Time Reductions For the Year Just Ended Demand Increase For the Year Just Ended Andrews Andrews 0 Andrews 0 Andrews 0 Baldwin 8 Baldwin 0 Baldwin 0 Baldwin 0 Chester Chester 0 Chester 0 Chester 0 Digby Digby 0 Digby 0 Digby 0 Erie Erie 0 Erie 0 Erie 0 Ferris Ferris 0 Ferris 0 Ferris 0 OX 0% 0% 0% O Material Labor Admin Cost Reductions Demand Increase R&D Cycle Time Reduction 1 Proforma Income Statement Teamname: Digby Industry ID: C133631 Round: 41 Year: 2026 Draft saved at Feb 24, 2022 06:47PM CST Daze $ 80,927 Dell $ 16,803 Duck $ 5,127 Dot $ 26,435 Dune NA NA NA TOTAL $ 31,055 $0 $0 $0 $ 160,348 0.0% 0 100.0% Income Statement Revenue Sales VARIABLE COSTS Direct Labor Direct Material 0 Inventory Carry Total Variable Costs Contribution Margin PERIOD COSTS Depreciation SG&A: R&D :Promotion :Sales Admin 0 Total Period Costs Net Margin $ 25,610 $ 30,122 $ 166 $ 55,897 $ 25,030 $ 4.948 $ 4,587 SO $ 9,535 $ 7.269 $1,223 $ 1,852 $0 $ 3,075 $ 2,053 $ 7.225 $ 11,687 $ 136 $ 19.049 $ 7.386 $ 8,522 $0 $0 $0 $ 11,526 $0 $0 $0 $0 $0 $0 $0 $ 20,048 $0 $0 $0 $ 11,007 $0 $0 $0 $ 47,529 $ 59,774 $ 302 $ 107,604 $ 52,743 29.6% 37.3% 0.2% 67.1% 32.9% $ 3,227 $0 $ 1,500 $ 1,849 $ 1,597 $ 8,173 $ 16,856 $ 2.427 SO $ 1.500 $ 1,849 $ 332 $ 6,107 $ 1,161 $ 1,080 $0 $ 750 $ 1,608 $ 101 $ 3,539 ($ 1,487) $ 1.080 $ 1,080 $0 $0 $0 $0 SO $0 $0 $0 $ 1,050 $1,250 $0 $0 $0 $ 1,447 $ 1,447 $0 $0 $0 $ 522 $ 613 $0 $0 $0 $ 4,099 $4,390 $0 $0 $0 $ 3.287 $6,617 $0 $0 $0 Other (Fees, Write Offs, TQM) EBITO Interest Taxes 0 Profit Sharing Net Profit $ 8,893 SO $ 6,050 $ 8,200 $ 3,165 $ 26,308 $ 26,435 SO $ 26,435 $4,657 $ 7,623 $ 297 $ 13,859 5.5% 0.0% 3.8% 5.1% 2.0% 16.4% 16.5% 0.0% 16.5% 2.9% 4.8% 0.2% 8.6% Annual Report Round: 3 Dec 31, 2025 Digby C133631 2025 Income Statement Duck Dune NA $13,815 $27,190 $31,062 50 NA Daze $42.928 Dot NA Dell $16.801 2025 Common Total Size $171.786 100.0% 50 50 Product Name:) Sales Mariable Costs: Direct Labor Direct Material Inventory Carry Total Variable Contribution Margin $27,772 $31.687 $69.469 SO $4.944 54.717 $0 $9.661 so $3,293 55,095 50 58,388 58,328 $12,182 537 $20,547 59.842 $11.697 $21.540 so 50 SSSS So 999 50 SSSS $54,179 $65 379 $37 $119,595 31.5% 38.1% 0.0% 69.6% SO $23468 $7.140 55,427 $6,543 $9,512 50 SO 50 $52.191 30.4 50 999999 SSSSSSS $742 5.2% 1.8% 3.5% 4.9% 2.4% 17.8% SSSSSSS 12.6% Period Costs: Depreciation $3.227 $2427 $1,050 $1,080 $1,000 SO 58.893 SGSA: R&D 5575 5464 5725 $690 $690 SO $3.146 Promotions $1.500 $1,500 $750 $1,050 $1 250 SO 55 050 Sales $1.886 $1.888 $1,640 $1,476 $1.476 SR.354 Admin $1992 5401 $330 $650 SO 54.105 Total Period $9,170 $6.679 54,528 $4,946 $5.238 SO $30.558 Net Margin $14.299 5461 5902 $1,597 $4274 50 SO $21633 Definitions Sales: Unt sales times list price. Direct Labor Labor costs incurred to produce the product that was sold. Inventory Carry Cost: the cost to carry unsold goods in inventory. Other $0 Depreciation Calculated on straight-ine 15-year depreciation of plant value R&D Cests: RAD BIT $21,633 Department expenditures for each product. Admin Administration Overhead is estimated at 1.5% Short Term Interes! or sales Promotions. The promotion budget for each product. Sales: The sales force budget for Long Term Niterest 54.657 each product. Other Charges not included in other categories such as Fees, Write Ofts, and Taxes $5.942 TOM. The fees include money paid to investment bankers and brokerage im to issue new Profit Sharing 5221 stocks or bonds plus consulting foes your instructor might assess. Write-offs include the loss you Net Profit $10,814 might experience when you sell capacity or liquidate inventory as the result of eliminating a production line. If the amount appears as a negative amount, then you actually made money on Variable Margins the liquidation of capacity or inventory. EBIT. Eamings Before Interest and Taxes. Short Term 2008 Digby C133531 Interest: Interest expense based on last year's current debt, including short term debt long term notes that have become due, and emergency loans. Long Term Interest Interest paid on outstanding bond. Taxes: Income tax based upon a 35% tax rate. Profit Sharing Profits Shared with employees under the labor contract. Net Profit: EBIT minus interest, Tas, and 3005 prof sharing 20.0% 10.0% 30 0.0% 12.6% 0.0% 2.7% 3.5% 0.1% 6.3% 0.0% Draft saved at Feb 24, 2022 06:47PM CST Process Management Initiatives Projected Impact Budget ($000) CPI Systems $ 0 Total Current Expenditures ($000): $0 Vendor/JIT $ 0 Best Case Quality Initiative Training $ 0 Worst Case 0.0% 0.0% Channel Support Systems $ 0 Projected Cumulative Impacts Material Cost Reduction Labor Cost Reduction Reduction R&D Cycle Time Reduction in Admin Costs 0.0% 0.0% Concurrent Engineering $ 0 0.0% 0.0% UNEP Green Programs $ 0 0.0% 0.0% $ 0 Demand increase 0.0% 0.0% $ 0 $ 0 Benchmarking Quality Function Deployment Effort CCE/6 Sigma Training GEMI TQEM Sustainability Initiatives Reduction in Cost of Goods For the Year Just Ended 0 Admin Cost Reductions For the Year Just Ended R&D Cycle Time Reductions For the Year Just Ended Demand Increase For the Year Just Ended Andrews Andrews 0 Andrews 0 Andrews 0 Baldwin 8 Baldwin 0 Baldwin 0 Baldwin 0 Chester Chester 0 Chester 0 Chester 0 Digby Digby 0 Digby 0 Digby 0 Erie Erie 0 Erie 0 Erie 0 Ferris Ferris 0 Ferris 0 Ferris 0 OX 0% 0% 0% O Material Labor Admin Cost Reductions Demand Increase R&D Cycle Time Reduction 1 Proforma Income Statement Teamname: Digby Industry ID: C133631 Round: 41 Year: 2026 Draft saved at Feb 24, 2022 06:47PM CST Daze $ 80,927 Dell $ 16,803 Duck $ 5,127 Dot $ 26,435 Dune NA NA NA TOTAL $ 31,055 $0 $0 $0 $ 160,348 0.0% 0 100.0% Income Statement Revenue Sales VARIABLE COSTS Direct Labor Direct Material 0 Inventory Carry Total Variable Costs Contribution Margin PERIOD COSTS Depreciation SG&A: R&D :Promotion :Sales Admin 0 Total Period Costs Net Margin $ 25,610 $ 30,122 $ 166 $ 55,897 $ 25,030 $ 4.948 $ 4,587 SO $ 9,535 $ 7.269 $1,223 $ 1,852 $0 $ 3,075 $ 2,053 $ 7.225 $ 11,687 $ 136 $ 19.049 $ 7.386 $ 8,522 $0 $0 $0 $ 11,526 $0 $0 $0 $0 $0 $0 $0 $ 20,048 $0 $0 $0 $ 11,007 $0 $0 $0 $ 47,529 $ 59,774 $ 302 $ 107,604 $ 52,743 29.6% 37.3% 0.2% 67.1% 32.9% $ 3,227 $0 $ 1,500 $ 1,849 $ 1,597 $ 8,173 $ 16,856 $ 2.427 SO $ 1.500 $ 1,849 $ 332 $ 6,107 $ 1,161 $ 1,080 $0 $ 750 $ 1,608 $ 101 $ 3,539 ($ 1,487) $ 1.080 $ 1,080 $0 $0 $0 $0 SO $0 $0 $0 $ 1,050 $1,250 $0 $0 $0 $ 1,447 $ 1,447 $0 $0 $0 $ 522 $ 613 $0 $0 $0 $ 4,099 $4,390 $0 $0 $0 $ 3.287 $6,617 $0 $0 $0 Other (Fees, Write Offs, TQM) EBITO Interest Taxes 0 Profit Sharing Net Profit $ 8,893 SO $ 6,050 $ 8,200 $ 3,165 $ 26,308 $ 26,435 SO $ 26,435 $4,657 $ 7,623 $ 297 $ 13,859 5.5% 0.0% 3.8% 5.1% 2.0% 16.4% 16.5% 0.0% 16.5% 2.9% 4.8% 0.2% 8.6% Annual Report Round: 3 Dec 31, 2025 Digby C133631 2025 Income Statement Duck Dune NA $13,815 $27,190 $31,062 50 NA Daze $42.928 Dot NA Dell $16.801 2025 Common Total Size $171.786 100.0% 50 50 Product Name:) Sales Mariable Costs: Direct Labor Direct Material Inventory Carry Total Variable Contribution Margin $27,772 $31.687 $69.469 SO $4.944 54.717 $0 $9.661 so $3,293 55,095 50 58,388 58,328 $12,182 537 $20,547 59.842 $11.697 $21.540 so 50 SSSS So 999 50 SSSS $54,179 $65 379 $37 $119,595 31.5% 38.1% 0.0% 69.6% SO $23468 $7.140 55,427 $6,543 $9,512 50 SO 50 $52.191 30.4 50 999999 SSSSSSS $742 5.2% 1.8% 3.5% 4.9% 2.4% 17.8% SSSSSSS 12.6% Period Costs: Depreciation $3.227 $2427 $1,050 $1,080 $1,000 SO 58.893 SGSA: R&D 5575 5464 5725 $690 $690 SO $3.146 Promotions $1.500 $1,500 $750 $1,050 $1 250 SO 55 050 Sales $1.886 $1.888 $1,640 $1,476 $1.476 SR.354 Admin $1992 5401 $330 $650 SO 54.105 Total Period $9,170 $6.679 54,528 $4,946 $5.238 SO $30.558 Net Margin $14.299 5461 5902 $1,597 $4274 50 SO $21633 Definitions Sales: Unt sales times list price. Direct Labor Labor costs incurred to produce the product that was sold. Inventory Carry Cost: the cost to carry unsold goods in inventory. Other $0 Depreciation Calculated on straight-ine 15-year depreciation of plant value R&D Cests: RAD BIT $21,633 Department expenditures for each product. Admin Administration Overhead is estimated at 1.5% Short Term Interes! or sales Promotions. The promotion budget for each product. Sales: The sales force budget for Long Term Niterest 54.657 each product. Other Charges not included in other categories such as Fees, Write Ofts, and Taxes $5.942 TOM. The fees include money paid to investment bankers and brokerage im to issue new Profit Sharing 5221 stocks or bonds plus consulting foes your instructor might assess. Write-offs include the loss you Net Profit $10,814 might experience when you sell capacity or liquidate inventory as the result of eliminating a production line. If the amount appears as a negative amount, then you actually made money on Variable Margins the liquidation of capacity or inventory. EBIT. Eamings Before Interest and Taxes. Short Term 2008 Digby C133531 Interest: Interest expense based on last year's current debt, including short term debt long term notes that have become due, and emergency loans. Long Term Interest Interest paid on outstanding bond. Taxes: Income tax based upon a 35% tax rate. Profit Sharing Profits Shared with employees under the labor contract. Net Profit: EBIT minus interest, Tas, and 3005 prof sharing 20.0% 10.0% 30 0.0% 12.6% 0.0% 2.7% 3.5% 0.1% 6.3% 0.0%
Step by Step Solution
There are 3 Steps involved in it

Get step-by-step solutions from verified subject matter experts