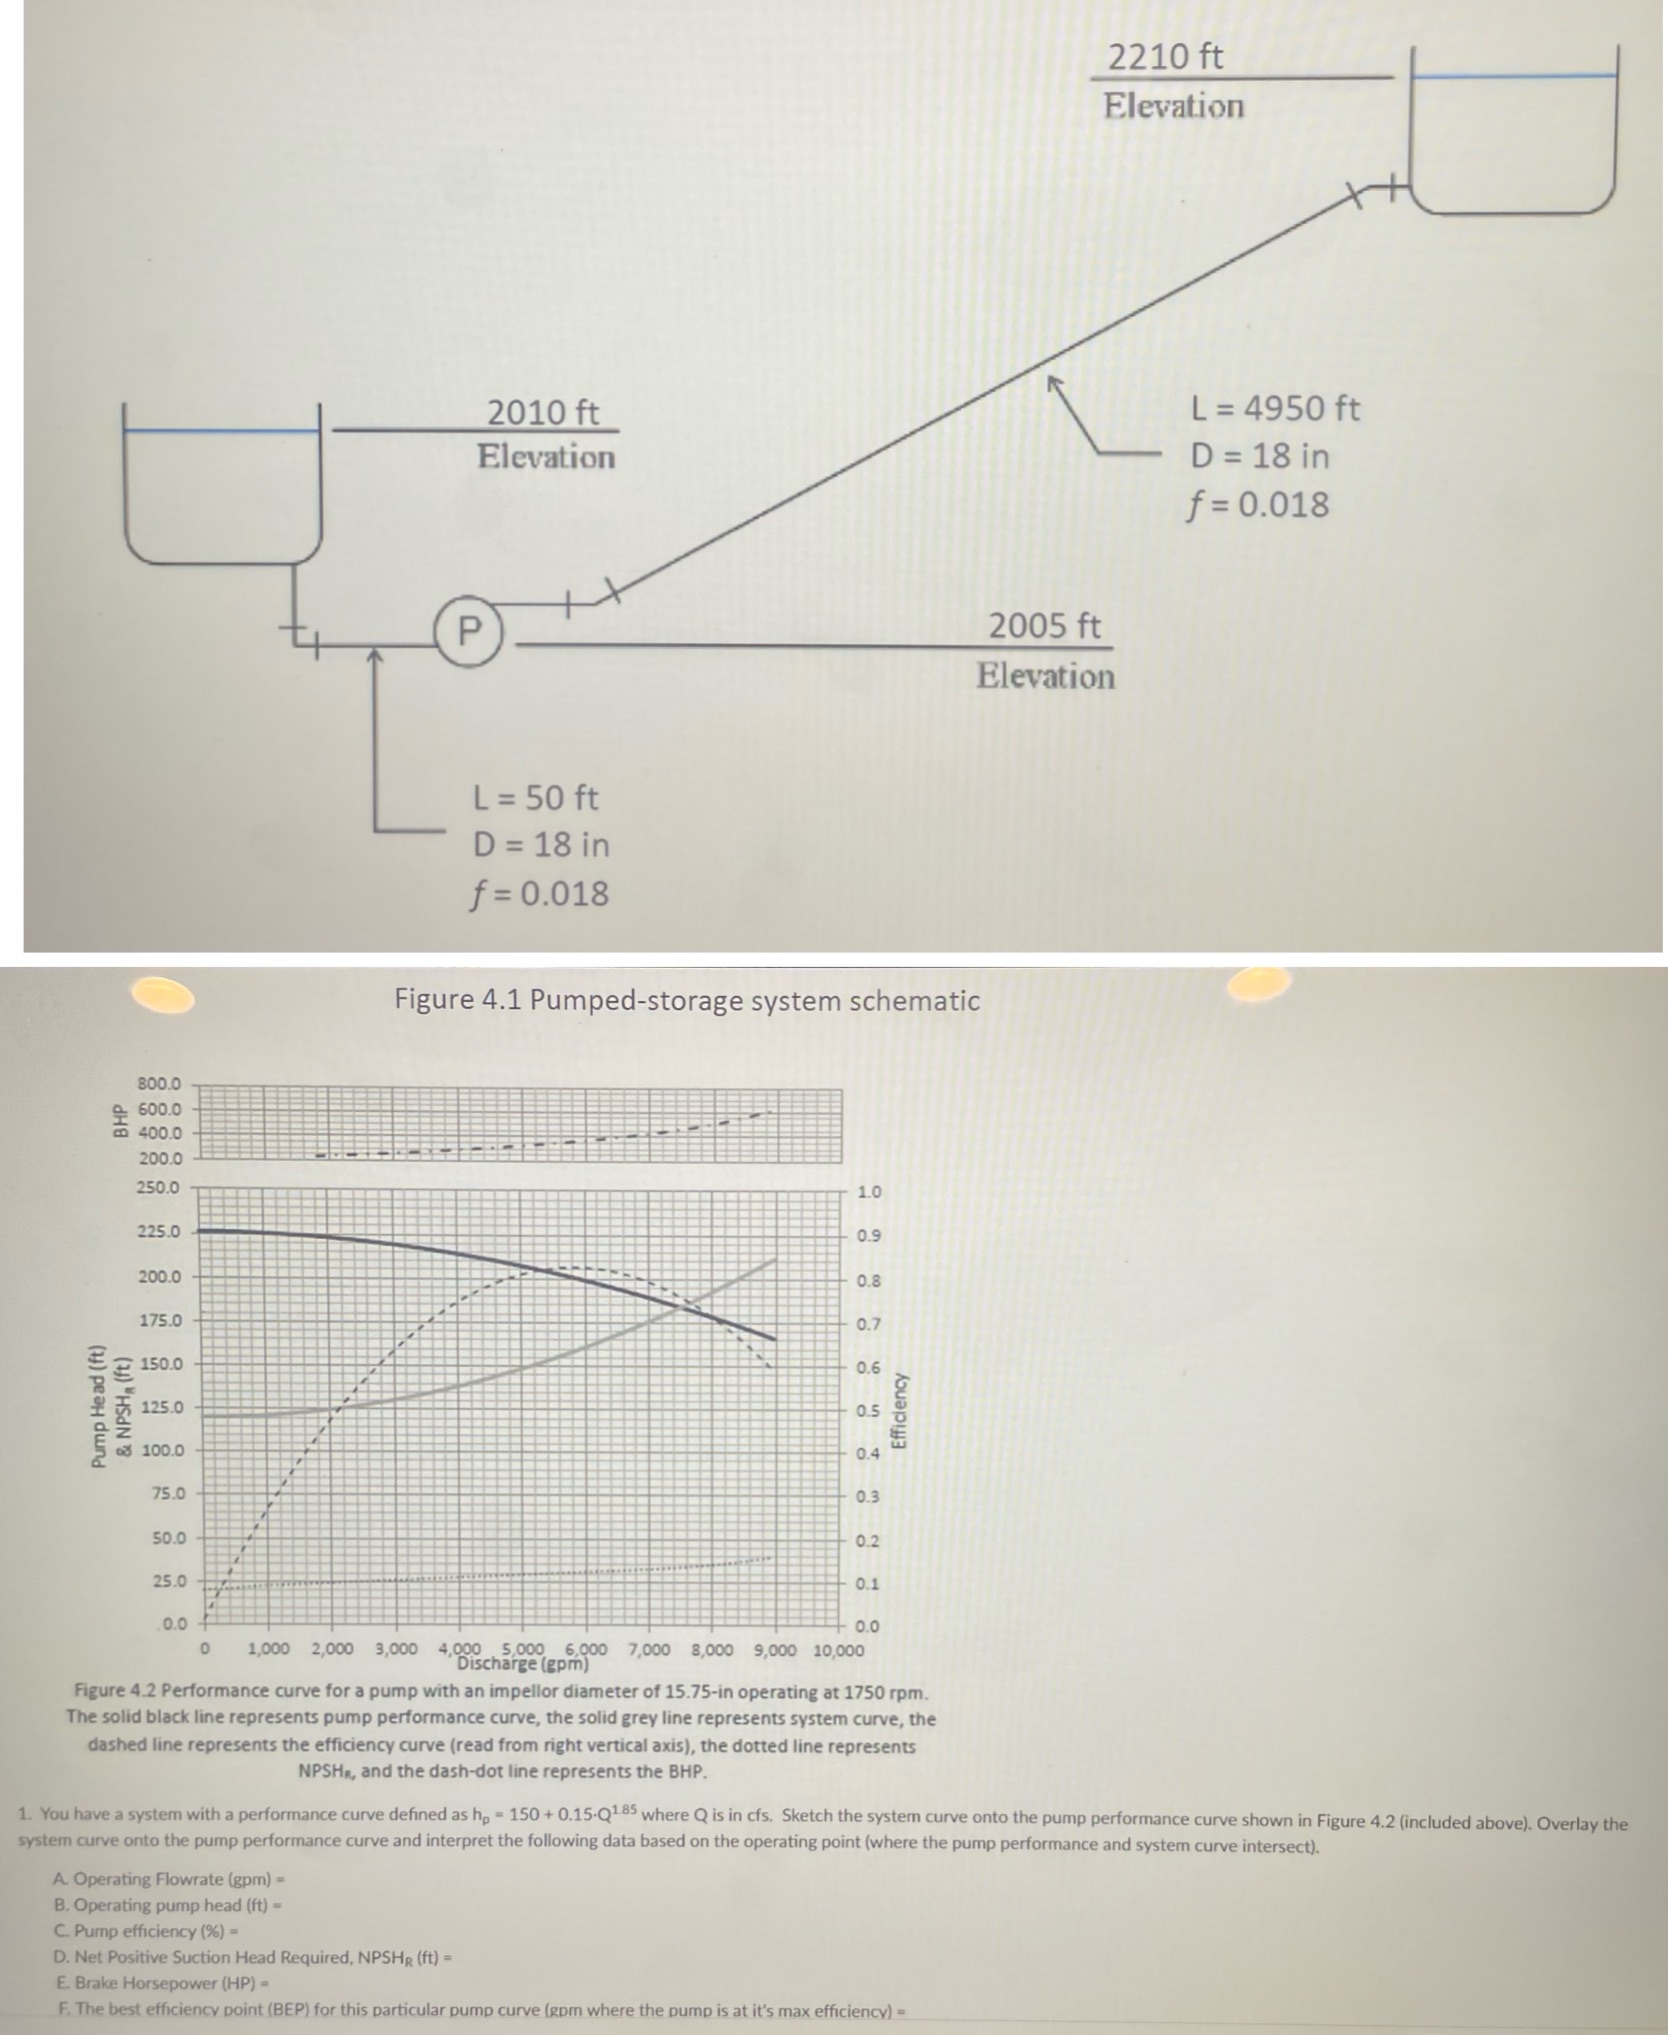
Question: Can you please help me sketch the graph and solve problem 1. Thank you! 2210 ft Elevation 2010 ft L = 4950 ft Elevation D

Can you please help me sketch the graph and solve problem 1. Thank you!

Can you please help me sketch the graph and solve
2210 ft Elevation 2010 ft L = 4950 ft Elevation D = 18 in f = 0.018 2005 ft Elevation L = 50 ft D = 18 in f = 0.018 Figure 4.1 Pumped-storage system schematic 800.0 600.0 en 400.0 200.0 250.0 1.0 225.0 0.9 200.0 0.8 175.0 0.7 150.0 0.6 PSHA (ft ficiency Pump Head (f 0.5 100.0 0.4 75.0 0.3 50.0 0.2 25.0 0.1 0.0 0.0 1,000 2,000 3,000 4,000 30 5,000 6,000 7,000 8,000 9,000 10,000 "Discharge (epm) Figure 4.2 Performance curve for a pump with an impellor diameter of 15.75-in operating at 1750 rpm. The solid black line represents pump performance curve, the solid grey line represents system curve, the dashed line represents the efficiency curve (read from right vertical axis), the dotted line represents NPSHa, and the dash-dot line represents the BHP. 1. You have a system with a performance curve defined as hp - 150 + 0.15-Q15 where Q is in cfs. Sketch the system curve onto the pump performance curve shown in Figure 4.2 (included above). Overlay the system curve onto the pump performance curve and interpret the following data based on the operating point (where the pump performance and system curve intersect). A. Operating Flowrate (gpm) - B. Operating pump head (ft) - C. Pump efficiency (%) = D. Net Positive Suction Head Required, NPSHR (ft) = ake Horsepower (HP) - est efficiency point (BEP) for this particular pump curve (Rom where the pump is at it's max efficiency) =

Step by Step Solution

There are 3 Steps involved in it

1 Expert Approved Answer
Step: 1 Unlock blur-text-image
Question Has Been Solved by an Expert!

Get step-by-step solutions from verified subject matter experts

Step: 2 Unlock
Step: 3 Unlock

Students Have Also Explored These Related Law Questions!