

Question: can you please help with this Q In these plots we model Australia's energy market. On the horizontal axis we have the quantity of energy,
can you please help with this Q
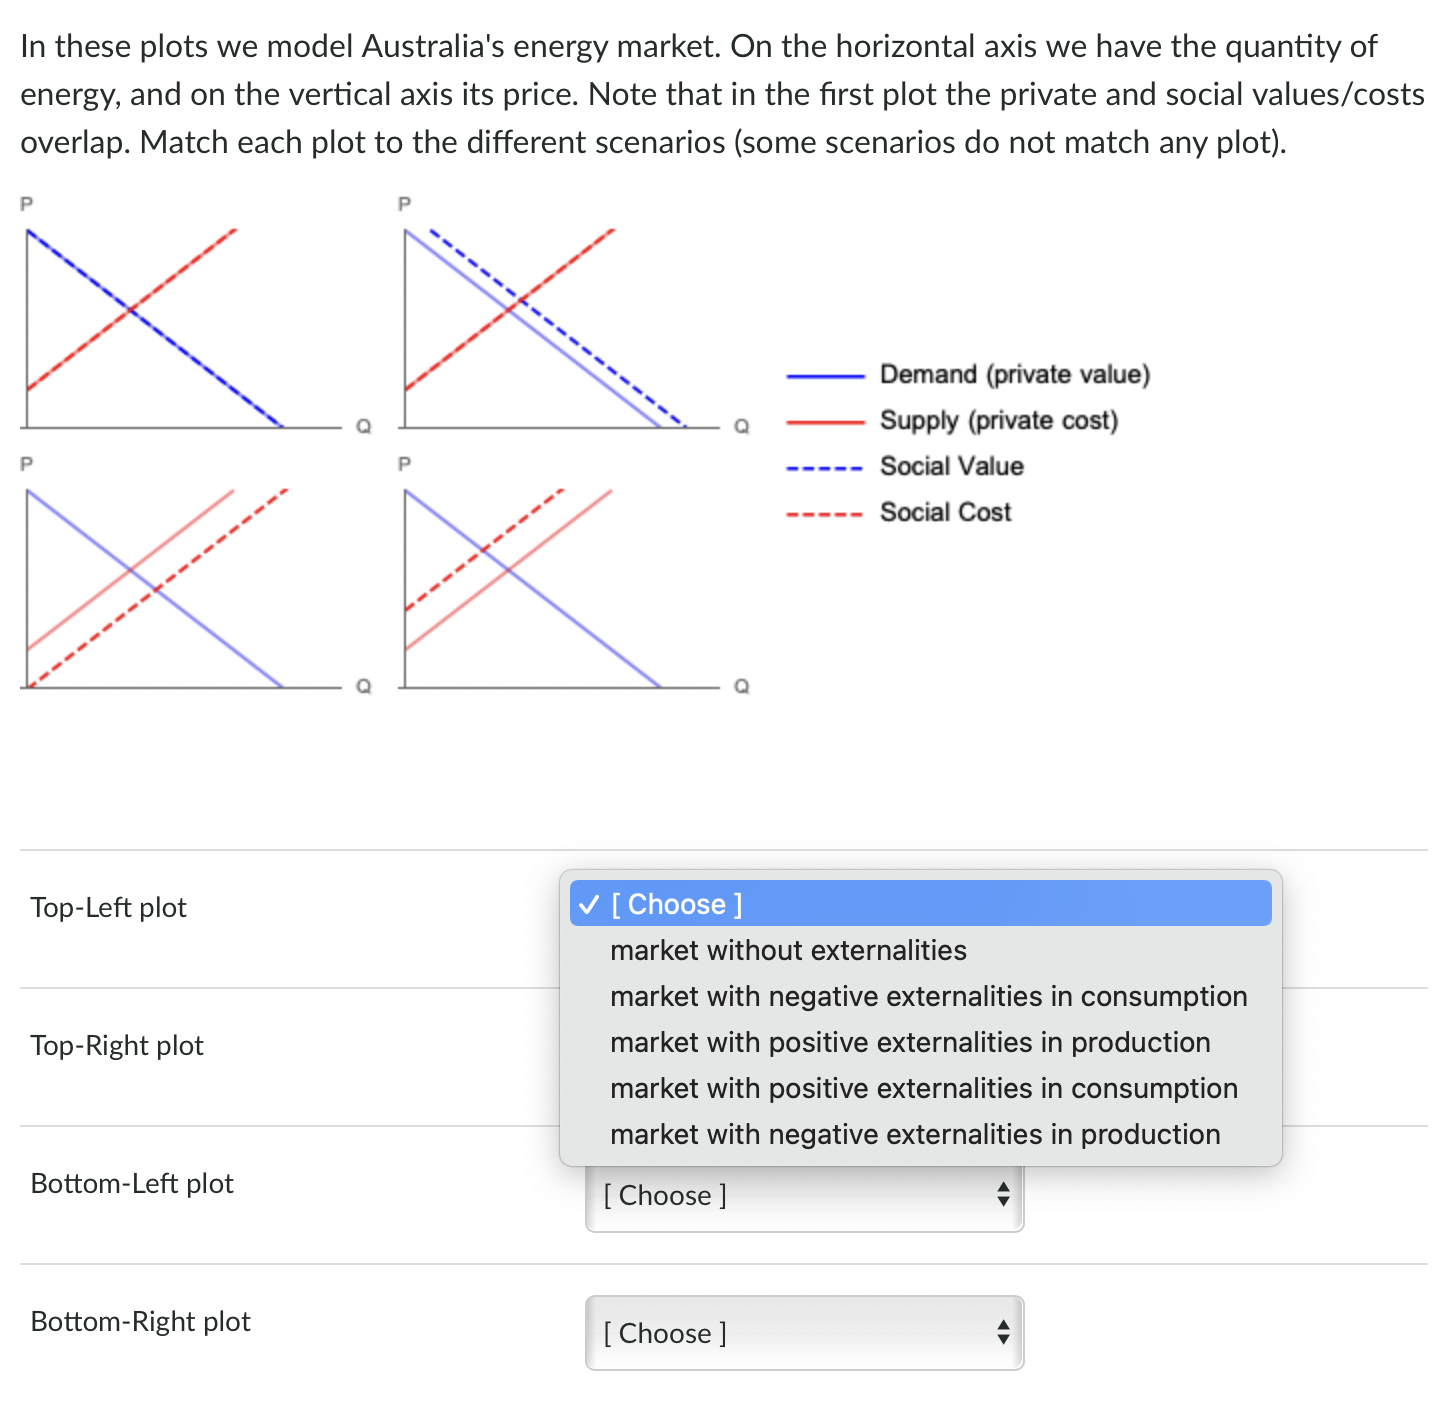
In these plots we model Australia's energy market. On the horizontal axis we have the quantity of energy, and on the vertical axis its price. Note that in the first plot the private and social values/costs overlap. Match each plot to the different scenarios (some scenarios do not match any plot). Demand (private value) Supply (private cost) ----- Social Value ----- Social Cost X Top-Left plot [ Choose ] market without externalities market with negative externalities in consumption Top-Right plot market with positive externalities in production market with positive externalities in consumption market with negative externalities in production Bottom-Left plot [ Choose ] Bottom-Right plot [ Choose ]
Step by Step Solution
There are 3 Steps involved in it

Get step-by-step solutions from verified subject matter experts