

Question: can you please show the work to complete the problem (Net Income Dividends) Shares Outstanding) 2. On another worksheet. Create a statement of cash flows
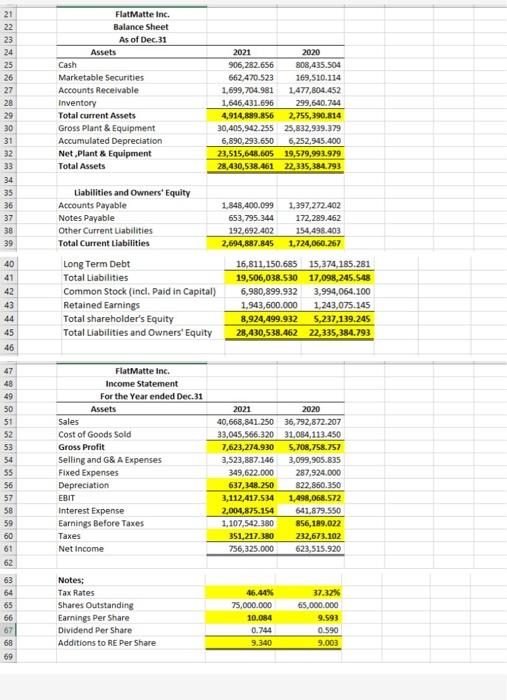
(Net Income Dividends) Shares Outstanding) 2. On another worksheet. Create a statement of cash flows for 2021. Use formulas linked directly to the source on the previous two worksheets instead of type numbers. 3. On separate worksheets, create a common-size income statement and a common-size balance sheet. You should be able to do these statements fairly quickly. For each common size statement, calculate just one formula and use copy-paste-special to copy and paste the formula into all accounts The formatting on common site statements should be identical to that in the wriginal worksheets only numbers format will diffen (Net Income Dividends) Shares Outstanding). 2. On another worksheet. Create a statement of cash flows for 2021. Use formulas linked directly to the source on the previous two worksheets instead of type numbers 3. On separate worksheets, create a common-size income statement and a common-sine balance sheet. You should be able to do these statements fairly quickly. For each common size statement, calculate just one formula and use copy-paste-special to copy and paste the formula into all accounts The formatting on common tire statements should be identical to that in the wiginal worksheets (only numbers format will differ) FlatMatte Inc. Balance Sheet As of Dec.31 Assets Cash 21 22 23 24 25 26 27 28 29 30 31 32 33 34 35 36 37 38 39 Marketable Securities Accounts Receivable Inventory Total current Assets Gross Plant & Equipment Accumulated Depreciation Net,Plant & Equipment Total Assets 2021 2020 906,282.656 808,435.504 662,470.523 169,510.114 1,699,704.981 1,477,804.452 1,646,431.696 299,640.744 4,914,889.856 2,755,390.814 30,405,942,255 25,832,939.379 6,890,293.650 6,252,945.400 23,515,648.605 19,579,993.979 28,430,538.461 22,335,384.793 Liabilities and Owners' Equity Accounts Payable Notes Payable Other Current Liabilities Total Current Liabilities 1,848,400.099 653,795.344 192,692.402 2,694,887.845 1,397,272.402 172,289.462 154,498.403 1,724,060.267 40 41 42 43 Long Term Debt Total Liabilities Common Stock (incl. Paid in Capital) Retained Earnings Total shareholder's Equity Total Liabilities and Owners' Equity 16,811,150.685 15,374,185.281 19,506,038.530 17,098,245.548 6,980,899.932 3,994,064.100 1,943,600.000 1,243,075.145 8,924,499.932 5,237,139.245 28,430,538.462 22,335,384.793 44 45 46 47 48 49 50 51 52 53 54 55 56 57 58 59 60 61 62 FlatMatte Inc. Income Statement For the Year ended Dec.31 Assets Sales Cost of Goods Sold Gross Profit Selling and G&A Expenses Fixed Expenses Depreciation EBIT Interest Expense Earnings Before Taxes Taxes Net Income 2021 2020 40,668,841.250 36,792,872.207 33,045,566.320 31,084,113.450 7,623,274.930 5,708,758.757 3,523,887.146 3,099,905.835 349,622.000 287.924.000 637,348.250 822,860.350 3,112,417.534 1,498,068.572 2,004,875.154 641.879.550 1,107,542.380 856,189.022 351,217.380 232,673.102 756,325.000 623,515.920 63 64 65 66 67 68 69 Notes: Tax Rates Shares Outstanding Earnings Per Share Dividend Per Share Additions to RE Per Share 46.44% 75,000.000 10.084 0.744 9.340 37.32% 65.000.000 9.593 0.590 9.003 (Net Income Dividends) Shares Outstanding) 2. On another worksheet. Create a statement of cash flows for 2021. Use formulas linked directly to the source on the previous two worksheets instead of type numbers. 3. On separate worksheets, create a common-size income statement and a common-size balance sheet. You should be able to do these statements fairly quickly. For each common size statement, calculate just one formula and use copy-paste-special to copy and paste the formula into all accounts The formatting on common site statements should be identical to that in the wriginal worksheets only numbers format will diffen (Net Income Dividends) Shares Outstanding). 2. On another worksheet. Create a statement of cash flows for 2021. Use formulas linked directly to the source on the previous two worksheets instead of type numbers 3. On separate worksheets, create a common-size income statement and a common-sine balance sheet. You should be able to do these statements fairly quickly. For each common size statement, calculate just one formula and use copy-paste-special to copy and paste the formula into all accounts The formatting on common tire statements should be identical to that in the wiginal worksheets (only numbers format will differ) FlatMatte Inc. Balance Sheet As of Dec.31 Assets Cash 21 22 23 24 25 26 27 28 29 30 31 32 33 34 35 36 37 38 39 Marketable Securities Accounts Receivable Inventory Total current Assets Gross Plant & Equipment Accumulated Depreciation Net,Plant & Equipment Total Assets 2021 2020 906,282.656 808,435.504 662,470.523 169,510.114 1,699,704.981 1,477,804.452 1,646,431.696 299,640.744 4,914,889.856 2,755,390.814 30,405,942,255 25,832,939.379 6,890,293.650 6,252,945.400 23,515,648.605 19,579,993.979 28,430,538.461 22,335,384.793 Liabilities and Owners' Equity Accounts Payable Notes Payable Other Current Liabilities Total Current Liabilities 1,848,400.099 653,795.344 192,692.402 2,694,887.845 1,397,272.402 172,289.462 154,498.403 1,724,060.267 40 41 42 43 Long Term Debt Total Liabilities Common Stock (incl. Paid in Capital) Retained Earnings Total shareholder's Equity Total Liabilities and Owners' Equity 16,811,150.685 15,374,185.281 19,506,038.530 17,098,245.548 6,980,899.932 3,994,064.100 1,943,600.000 1,243,075.145 8,924,499.932 5,237,139.245 28,430,538.462 22,335,384.793 44 45 46 47 48 49 50 51 52 53 54 55 56 57 58 59 60 61 62 FlatMatte Inc. Income Statement For the Year ended Dec.31 Assets Sales Cost of Goods Sold Gross Profit Selling and G&A Expenses Fixed Expenses Depreciation EBIT Interest Expense Earnings Before Taxes Taxes Net Income 2021 2020 40,668,841.250 36,792,872.207 33,045,566.320 31,084,113.450 7,623,274.930 5,708,758.757 3,523,887.146 3,099,905.835 349,622.000 287.924.000 637,348.250 822,860.350 3,112,417.534 1,498,068.572 2,004,875.154 641.879.550 1,107,542.380 856,189.022 351,217.380 232,673.102 756,325.000 623,515.920 63 64 65 66 67 68 69 Notes: Tax Rates Shares Outstanding Earnings Per Share Dividend Per Share Additions to RE Per Share 46.44% 75,000.000 10.084 0.744 9.340 37.32% 65.000.000 9.593 0.590 9.003
Step by Step Solution
There are 3 Steps involved in it
To complete the tasks outlined heres a stepbystep guide 1 Statement of Cash Flows for 2021 The state... View full answer

Get step-by-step solutions from verified subject matter experts