

Question: Canvas Statistics for three assets A, B & C are shown in the following tables Asset Table Asset A Asset B Asset C Standard Deviation
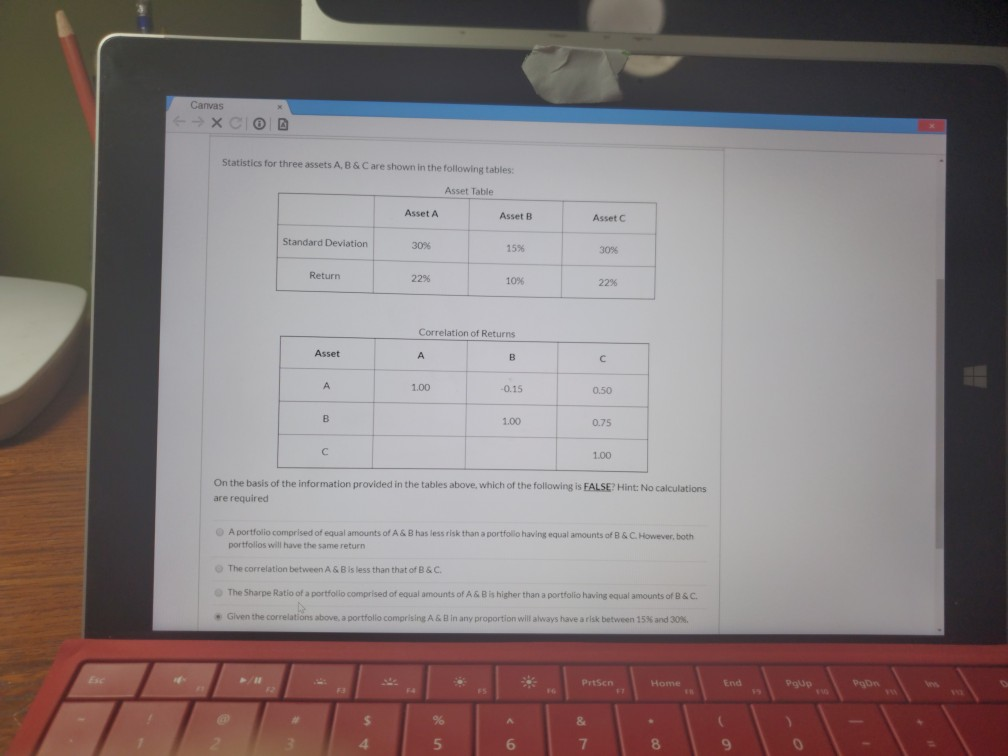
Canvas Statistics for three assets A, B & C are shown in the following tables Asset Table Asset A Asset B Asset C Standard Deviation 30% 15% 30% Return 22 % 10% 22 % Correlation of Returns Asset A C A 1.00 -0.15 0.50 E 1.00 0.75 C 1.00 On the basis of the information provided in the tables above, which of the following is EALSE? Hint: No calculations are required Aportfolio comprised of equal amounts of A & B has less risk than a portfollo having equal amounts of B & C.However, both portfollos willl have the same return O The correlation between A & B is less than that of B & C The Sharpe Ratio of a portfollo comprised of equal amounts of A& B is higher than a portfolio having equal amounts of B & C Given the correlations above, a portfolio comprising A & B in any proportion will always have a risk between 15 % and 30 % Esc PrtScn End PgUp PoDn Home FA % & 6 7
Step by Step Solution
There are 3 Steps involved in it

Get step-by-step solutions from verified subject matter experts