

Question: Case 2 Last 2 paragraphs before the references is the question. Please be as elaborate as possible, this is a Strategic Management university paper. Please
Case 2
Last 2 paragraphs before the references is the question. Please be as elaborate as possible, this is a Strategic Management university paper.
Please give a complete analysis of the case. Identify the problems and give solutions. Give a complete SWOT and PESTEL analysis of the Case study (SWOT and PESTEL). What is their competitive advantage over the market? What are your recommendations?
NOTE - Page 13 has been submitted as a screenshot since the file was heavy.
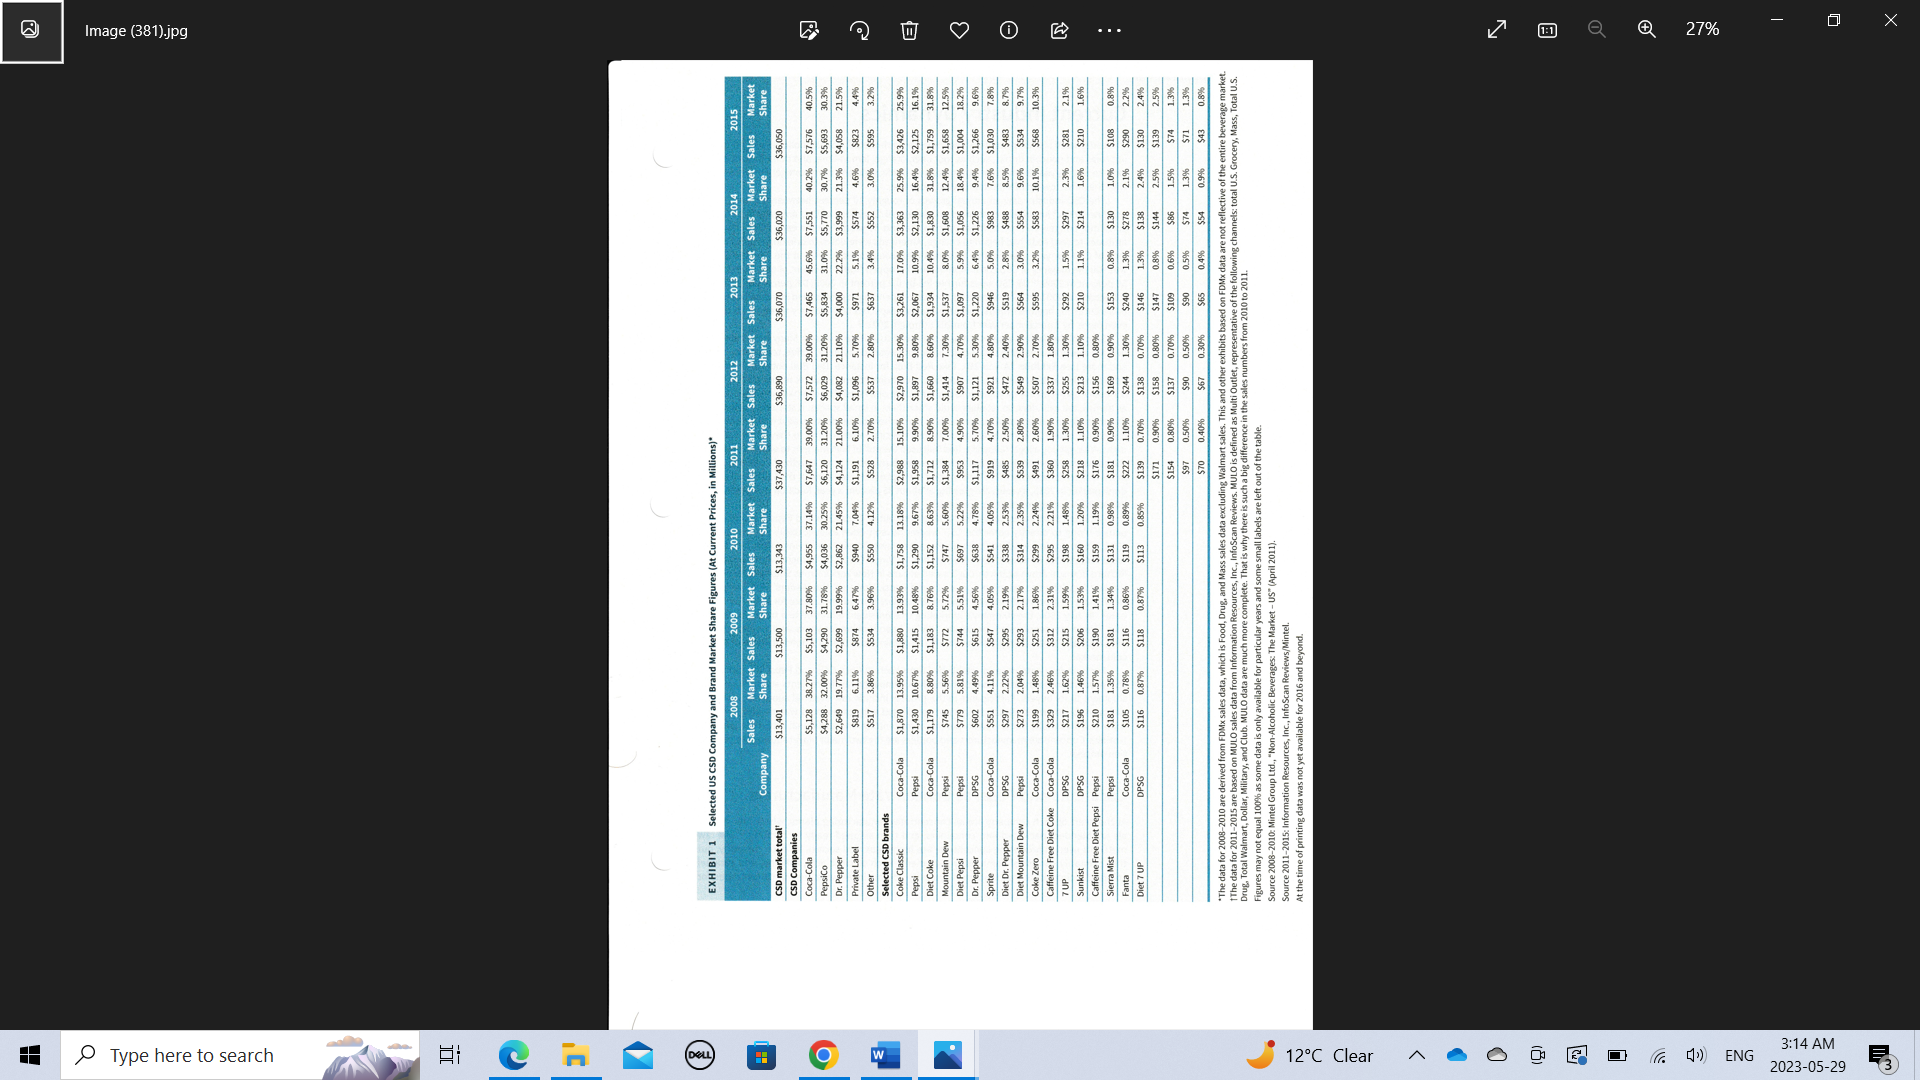
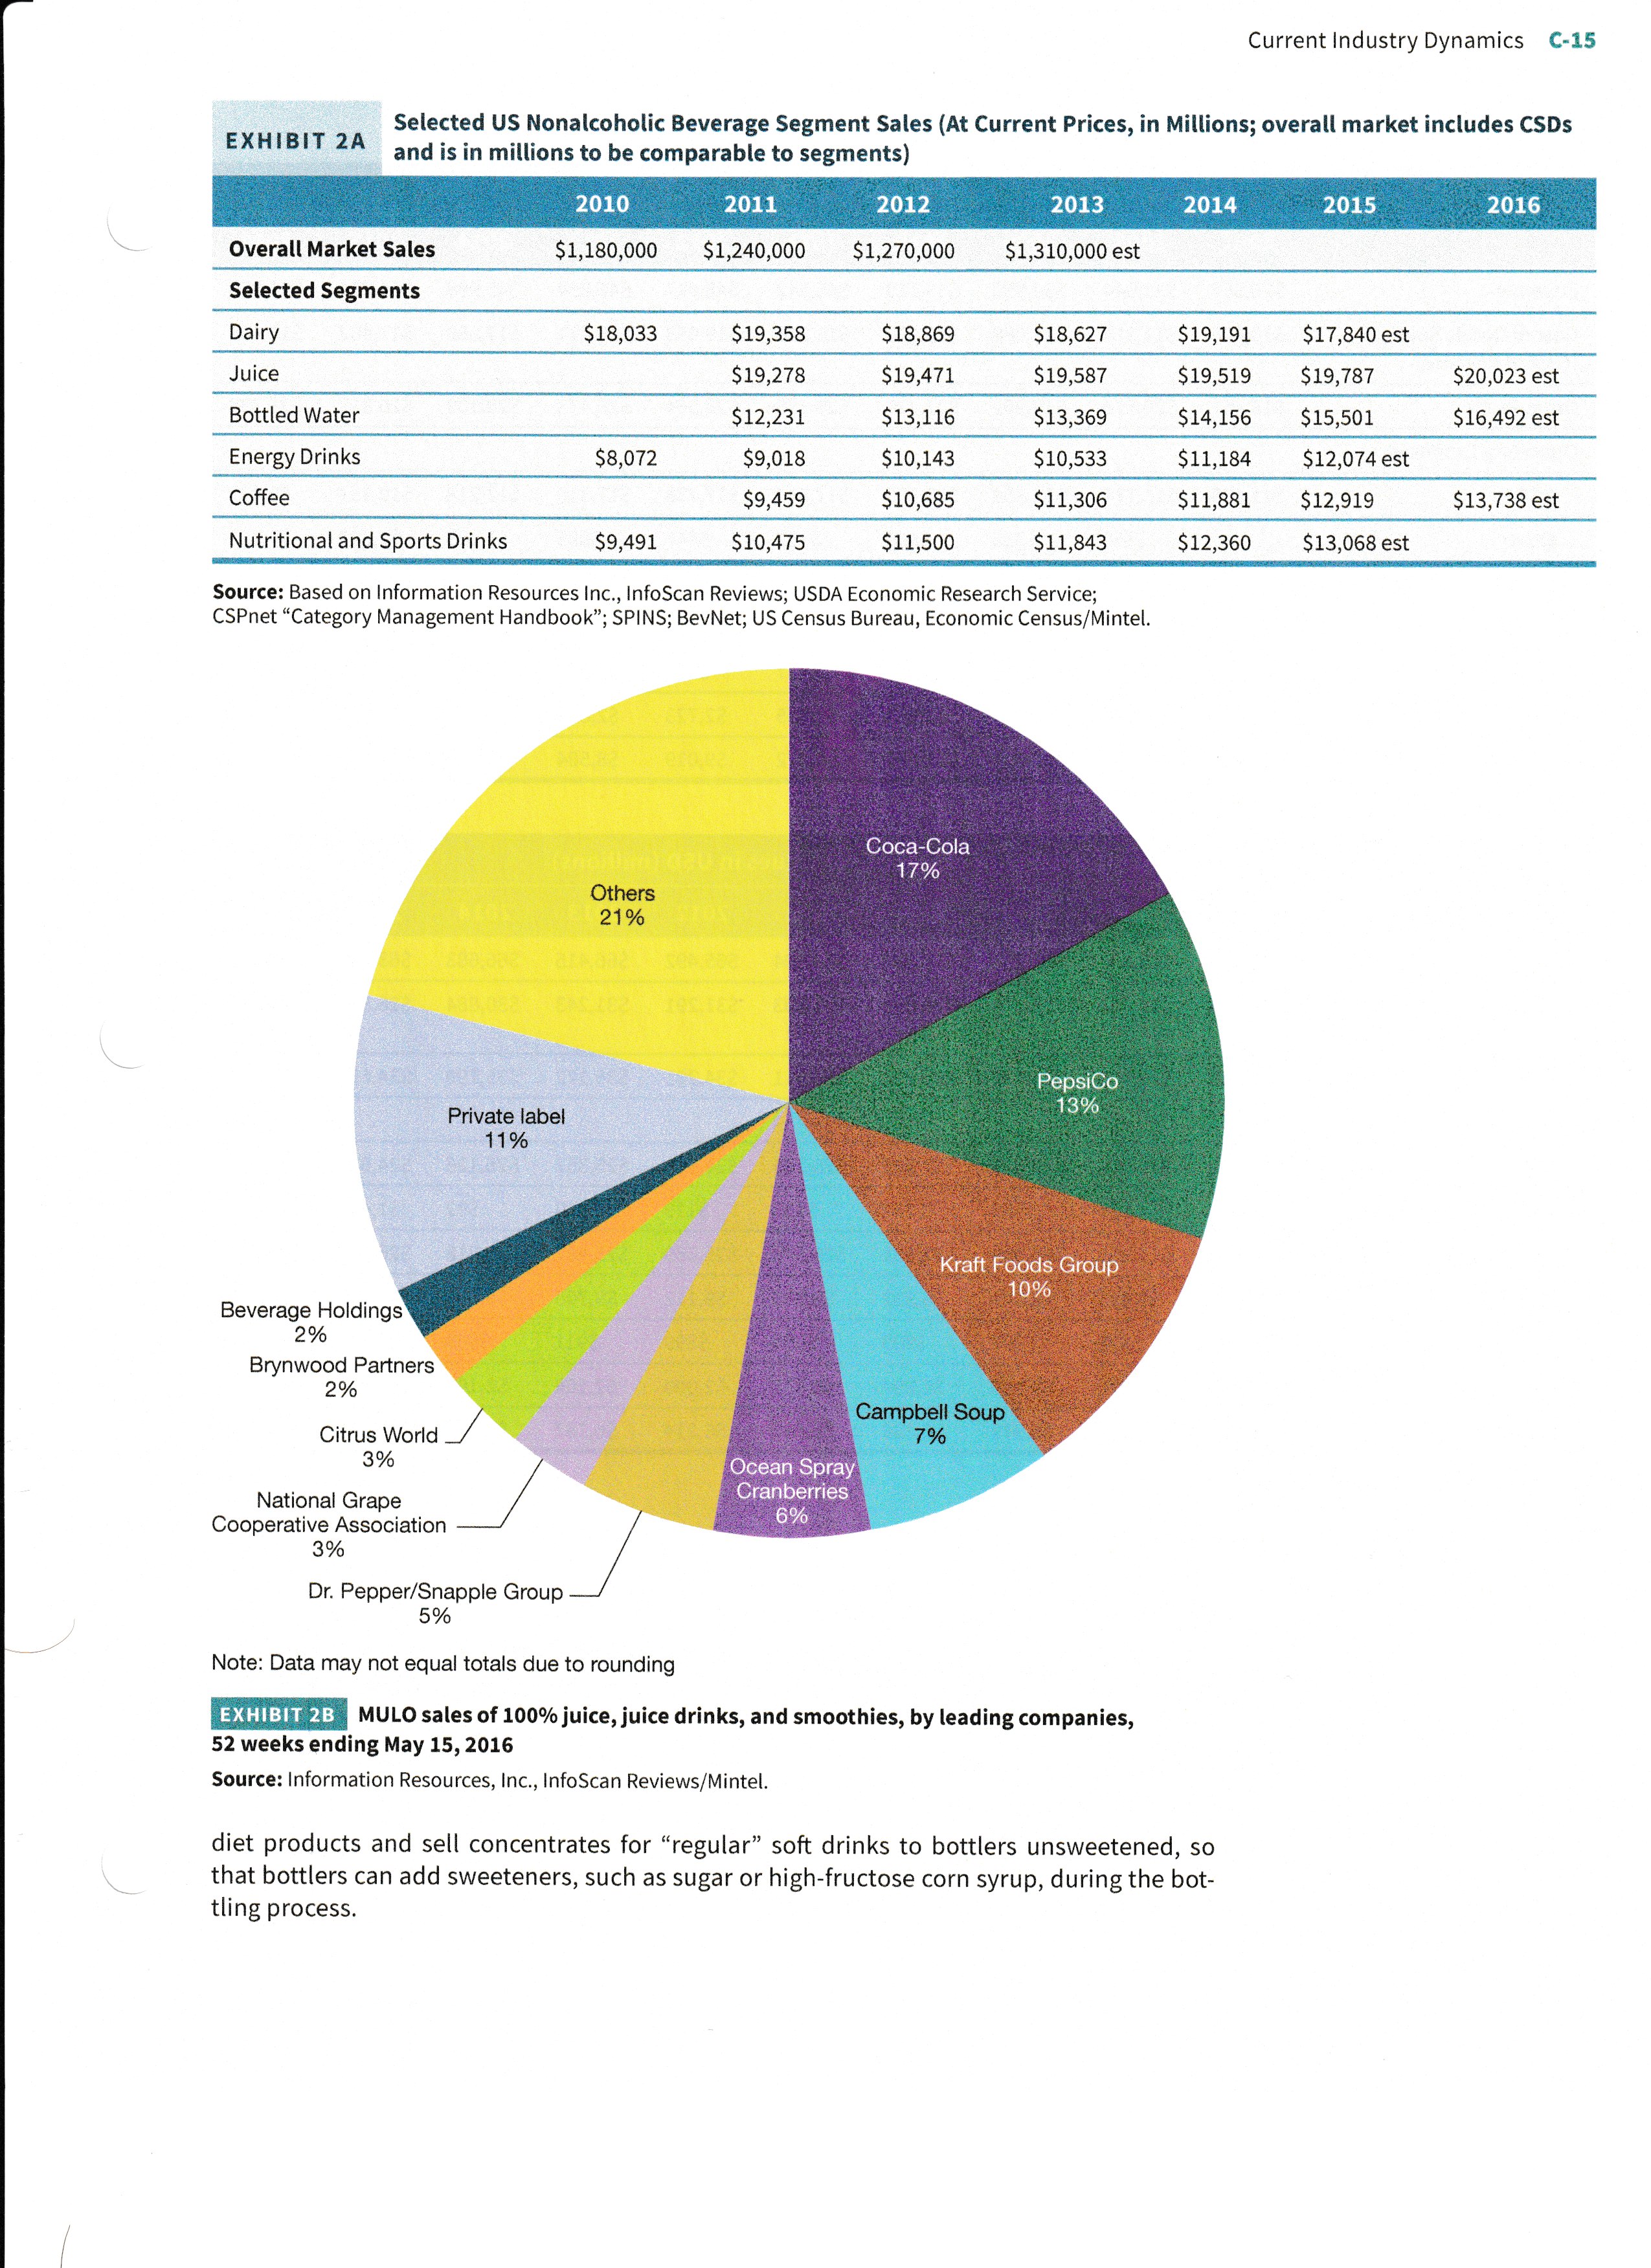
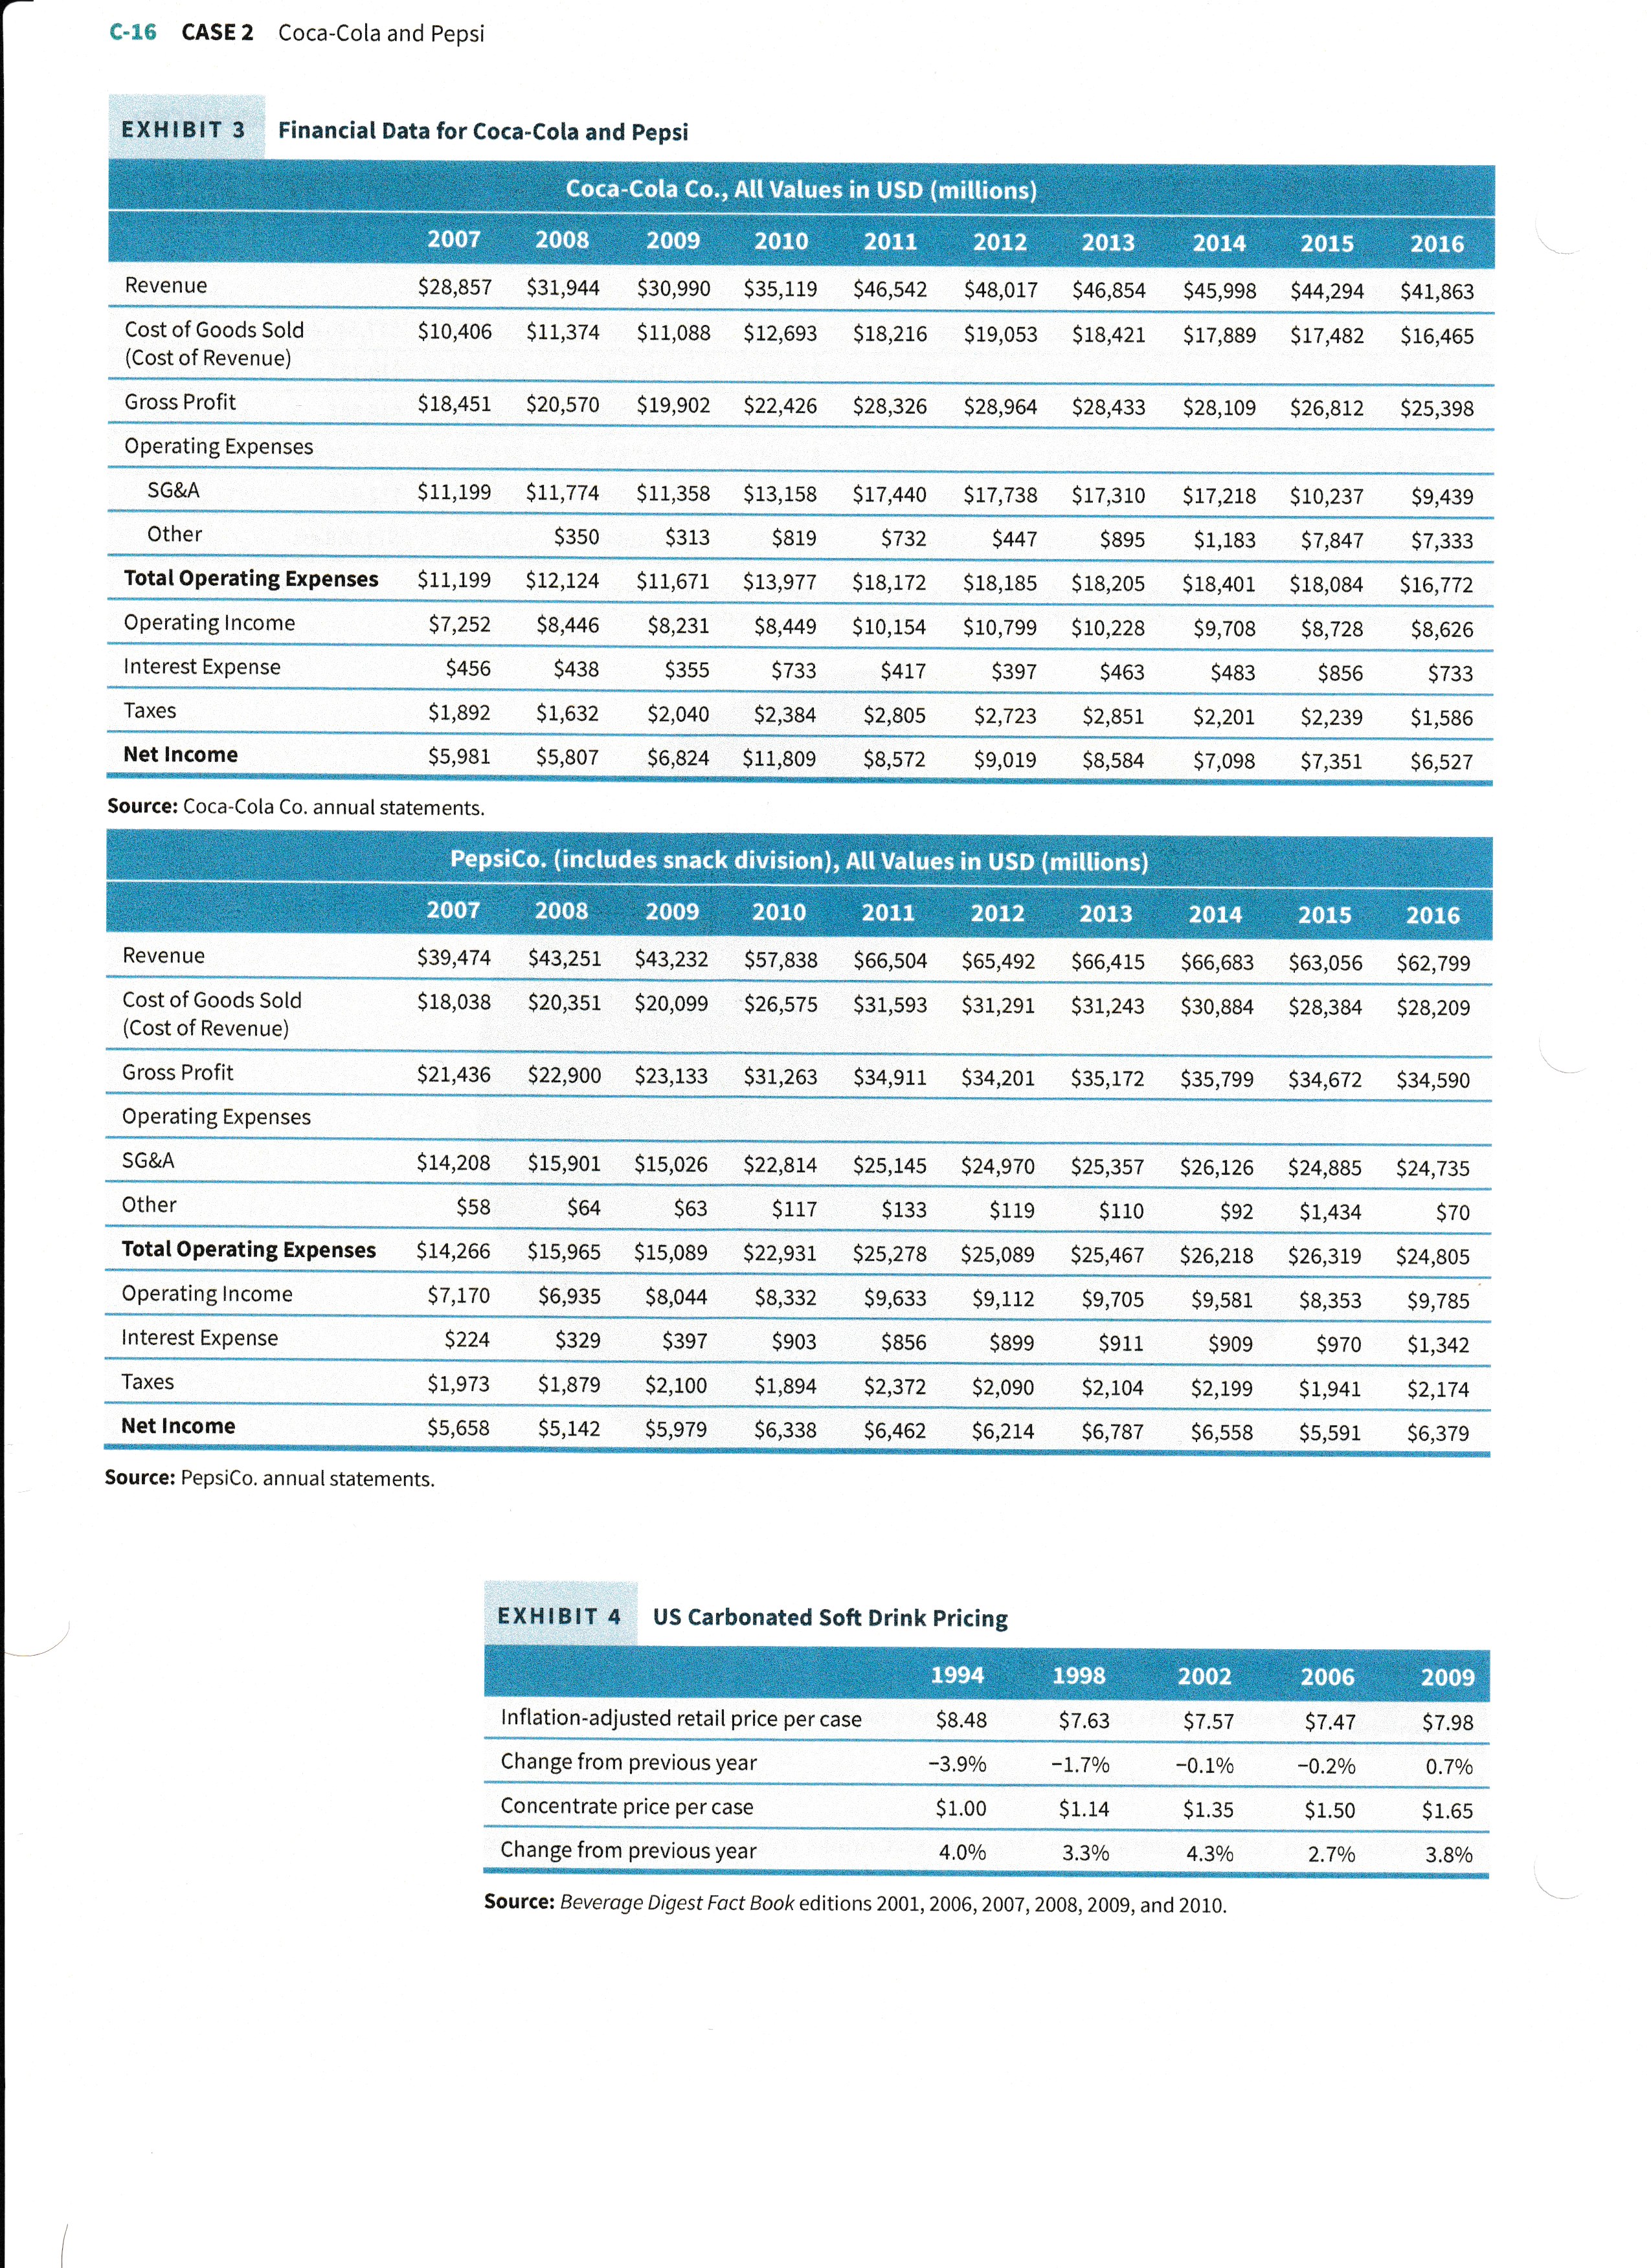
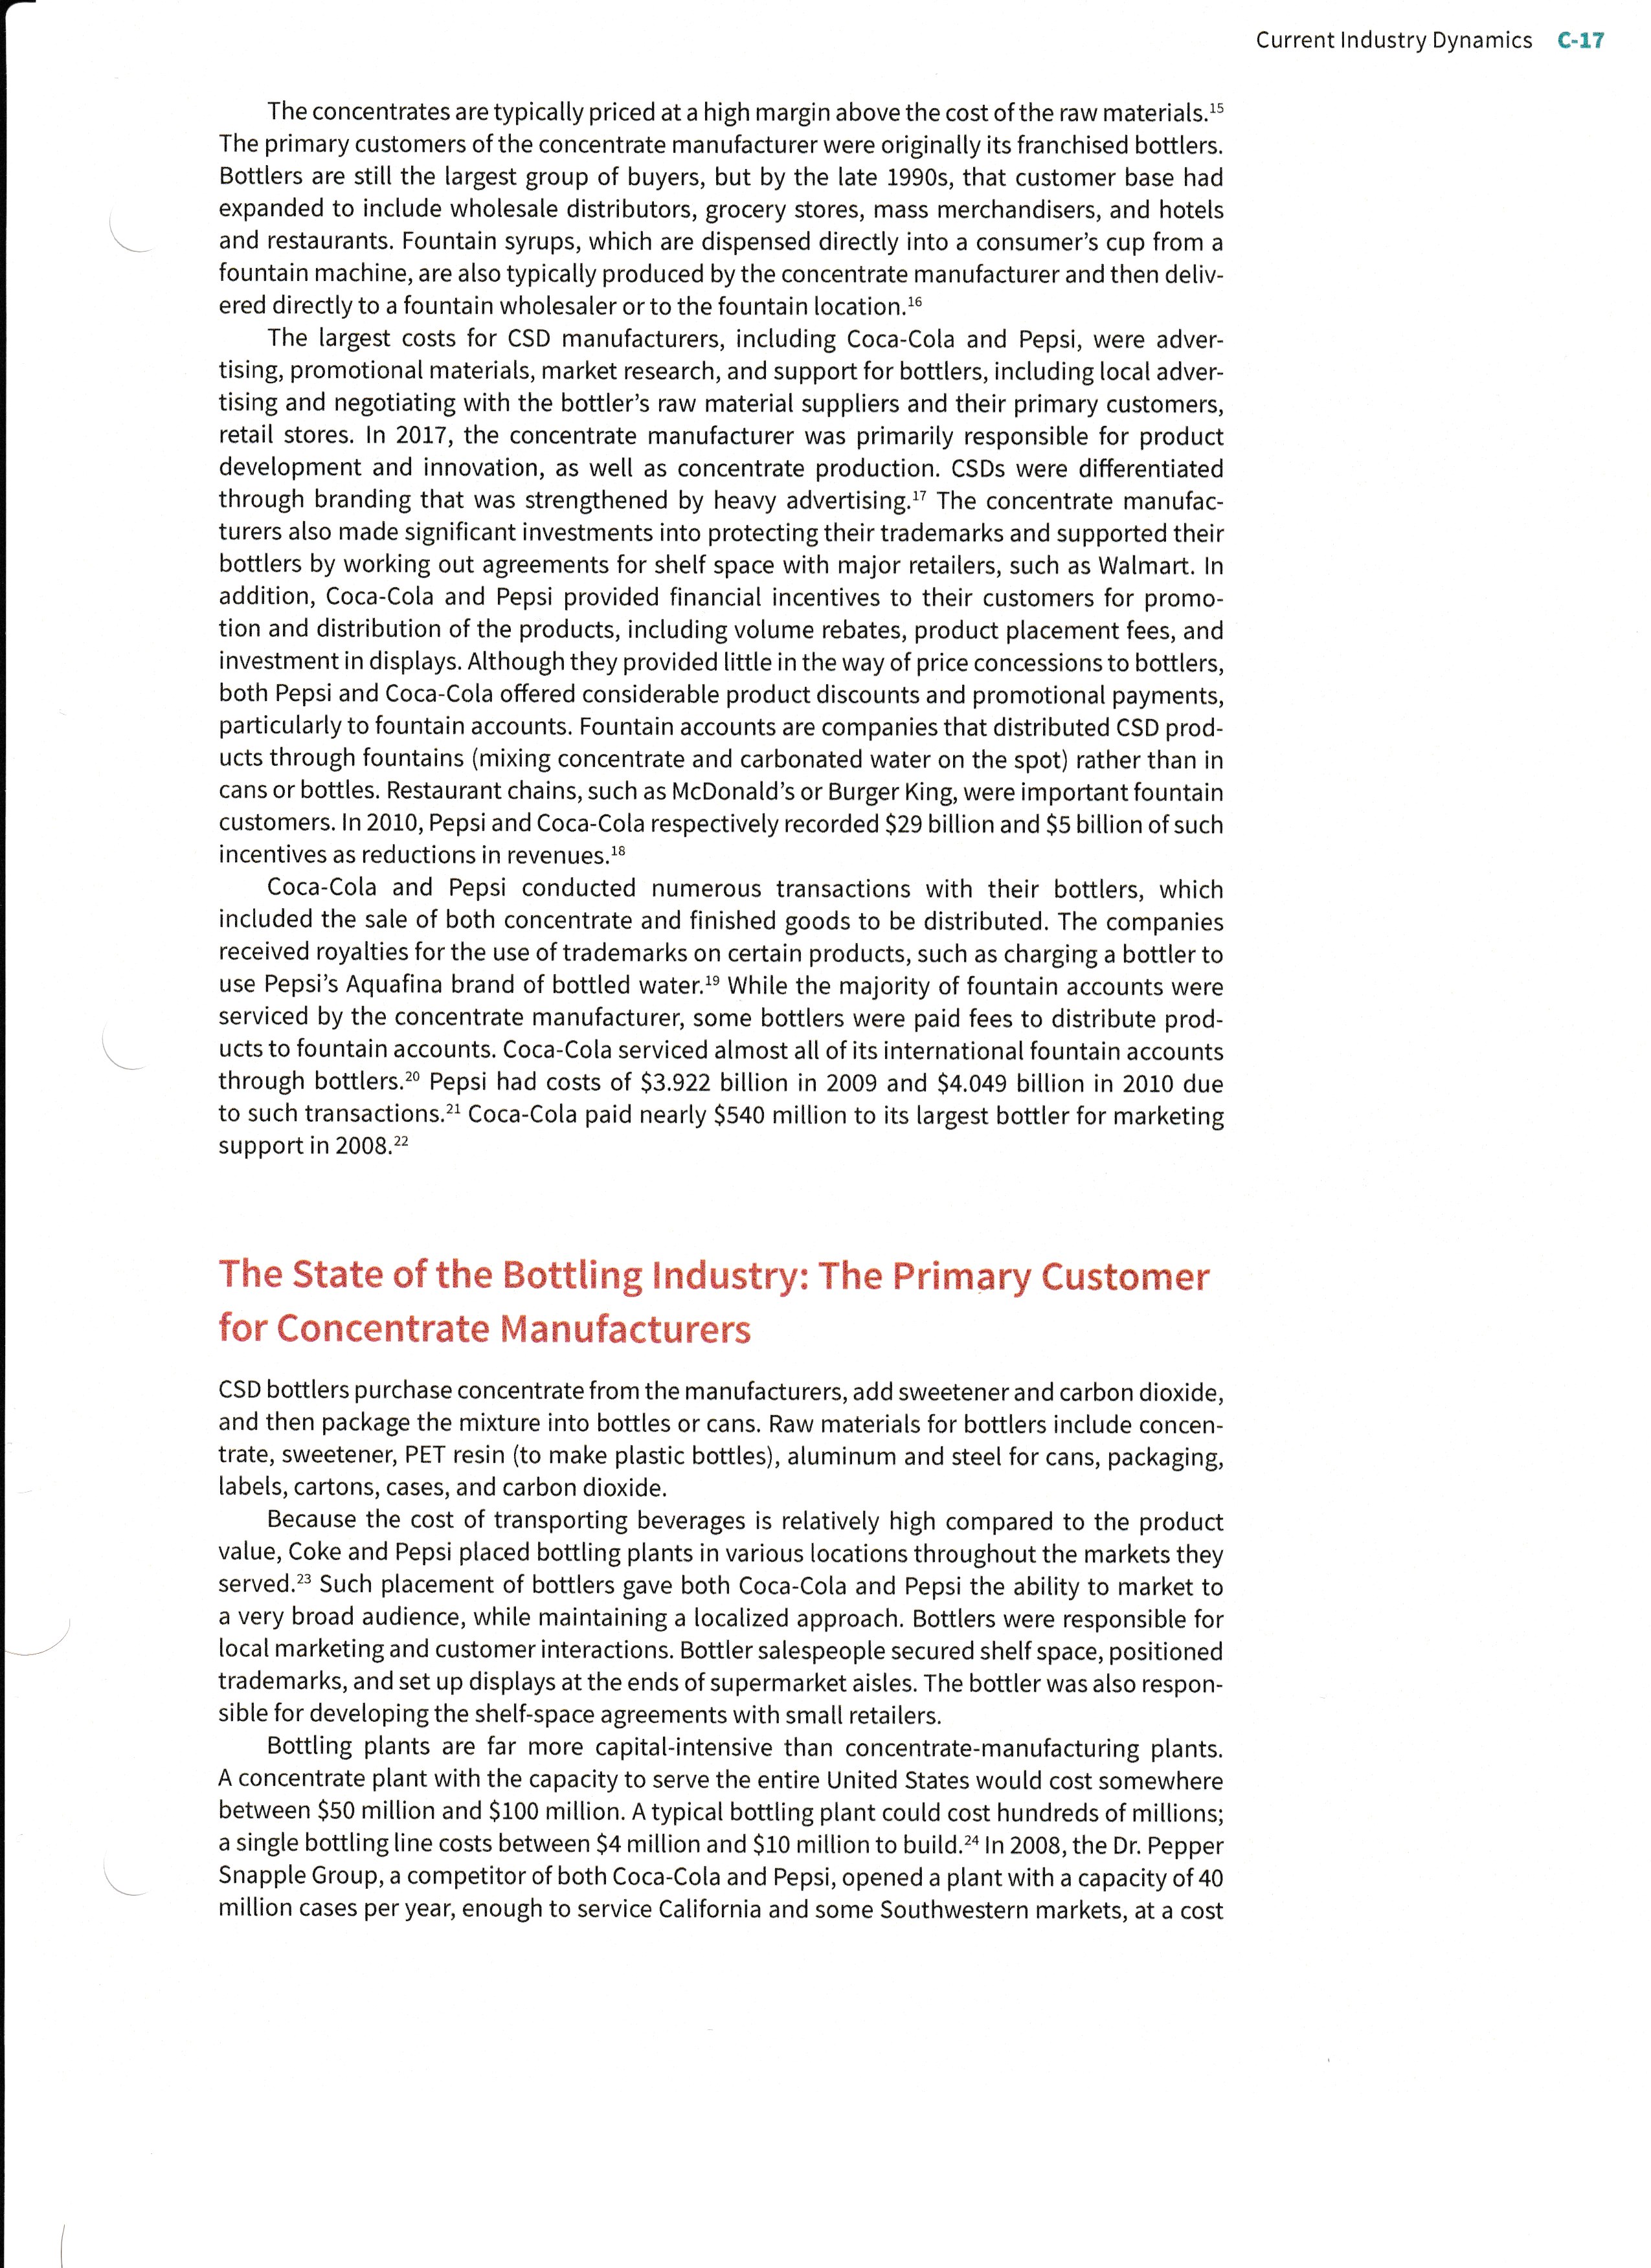
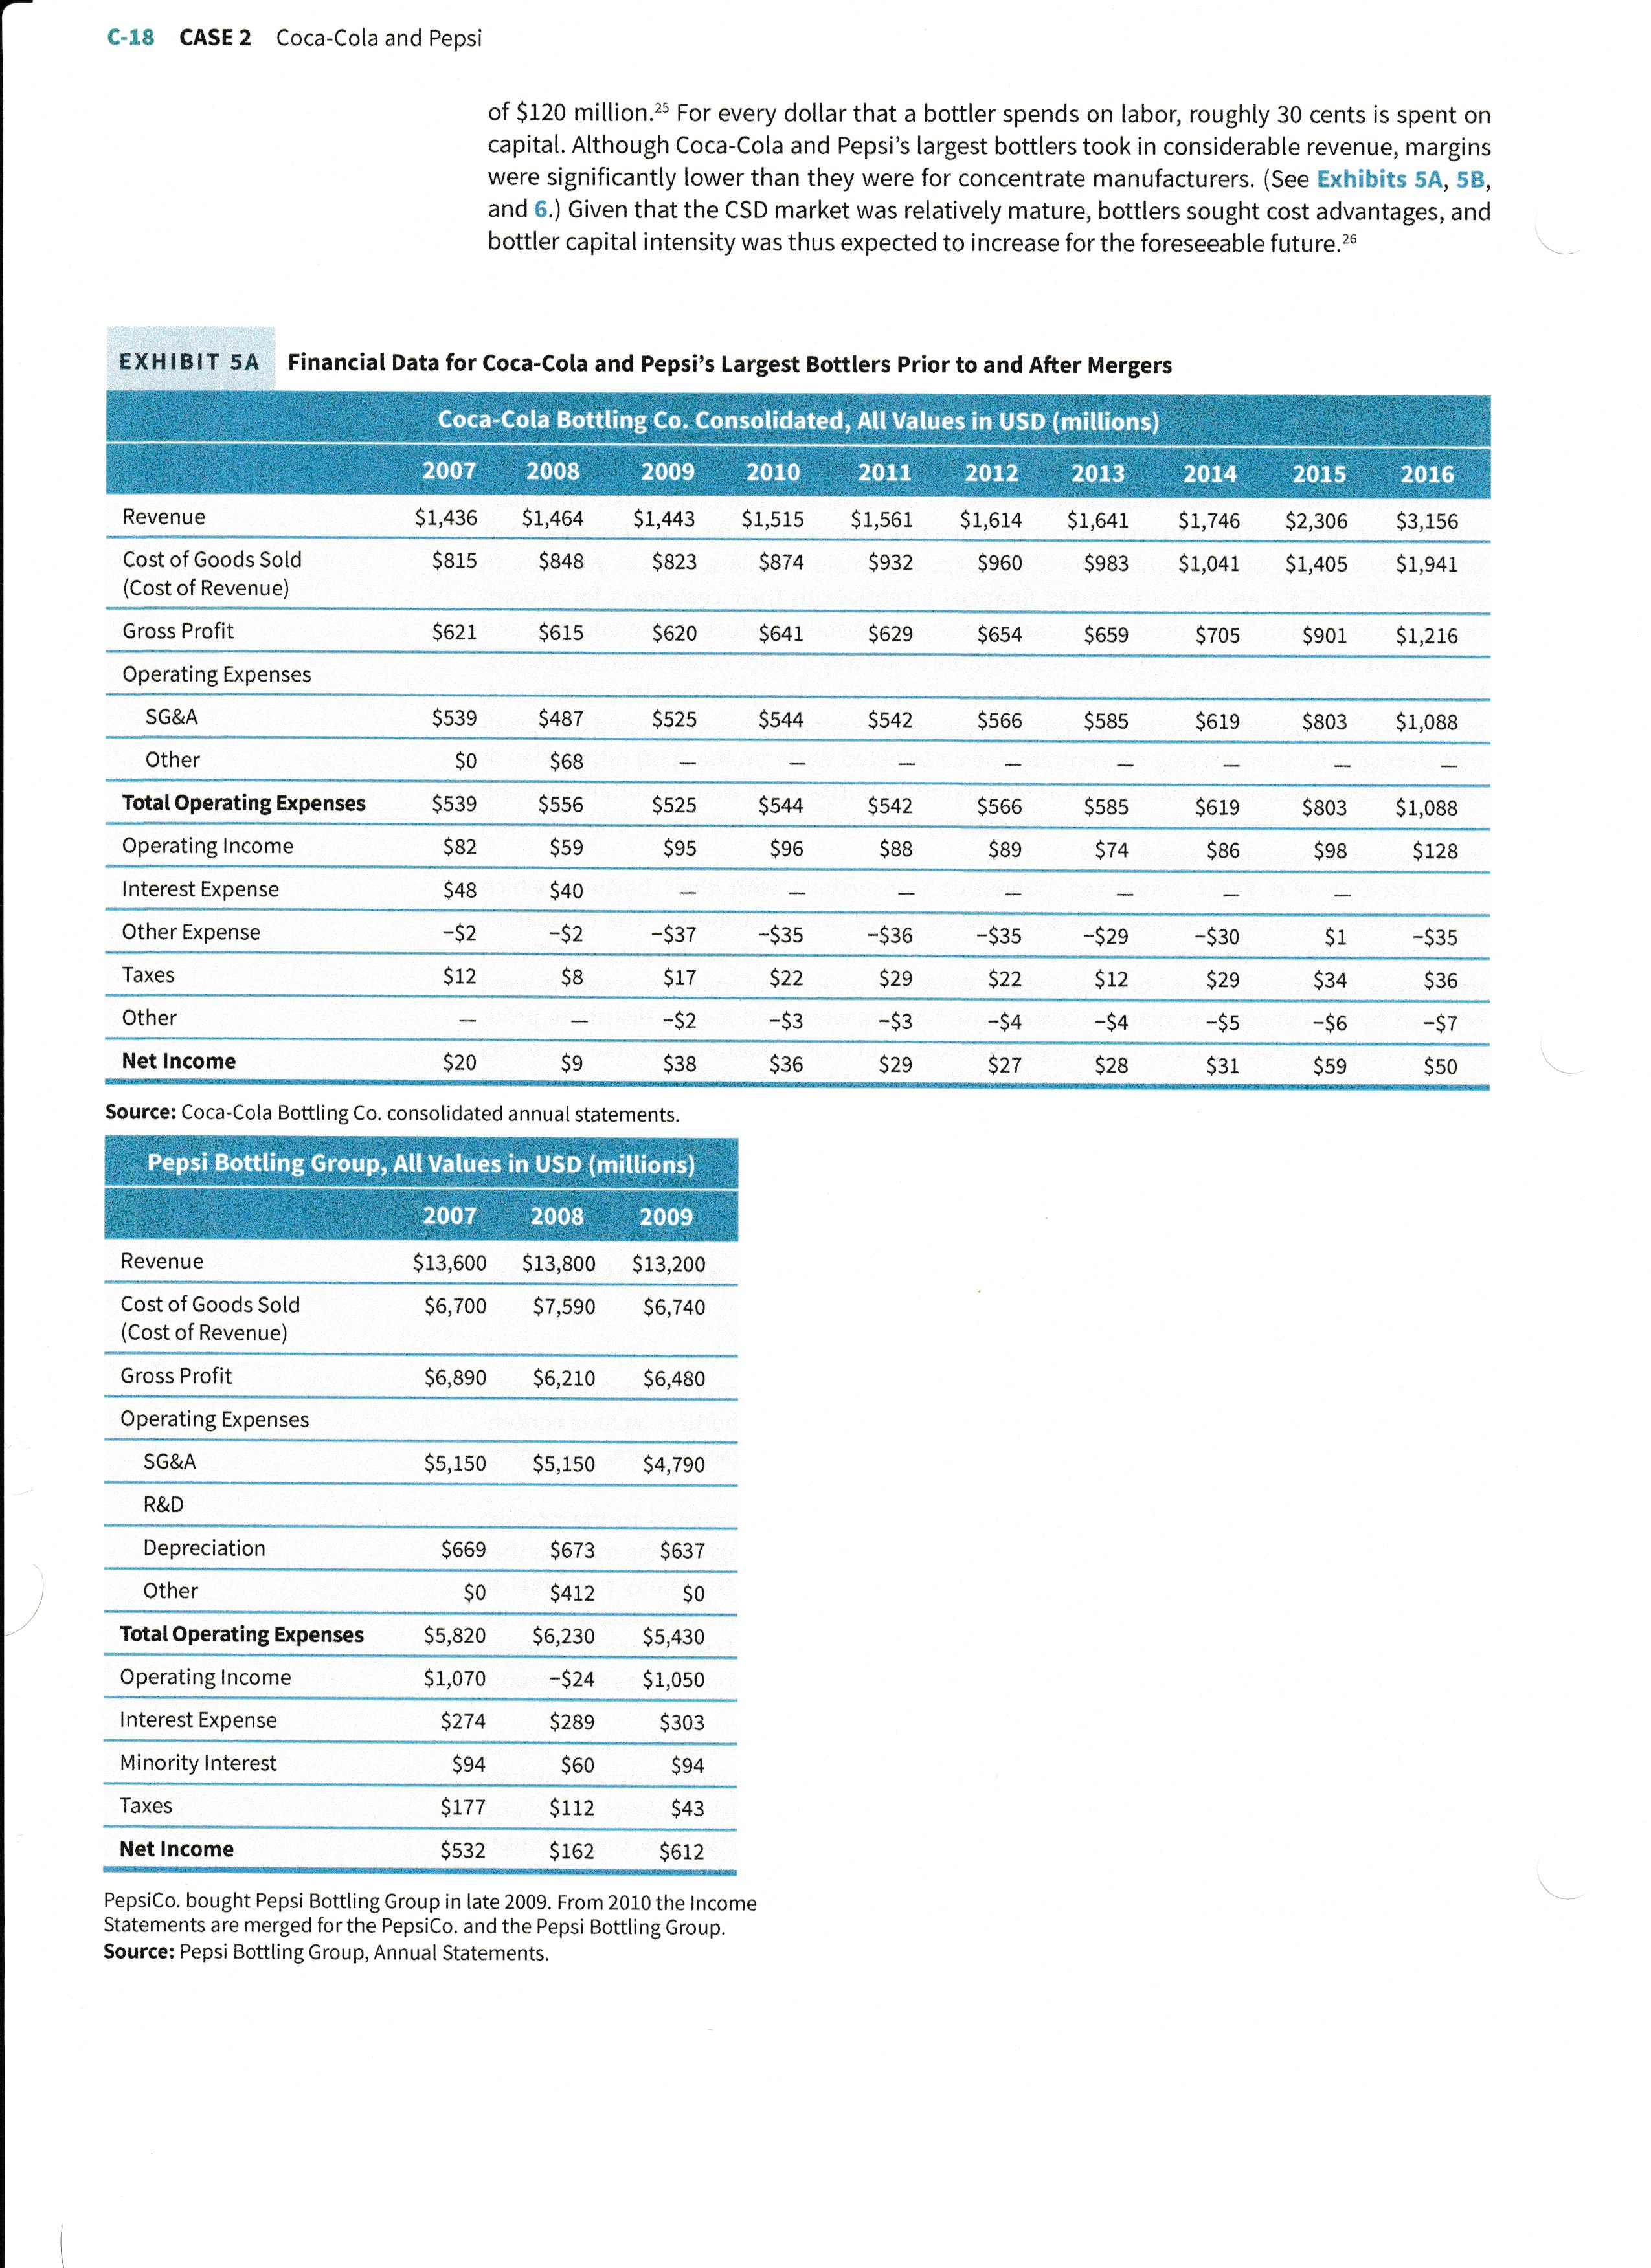
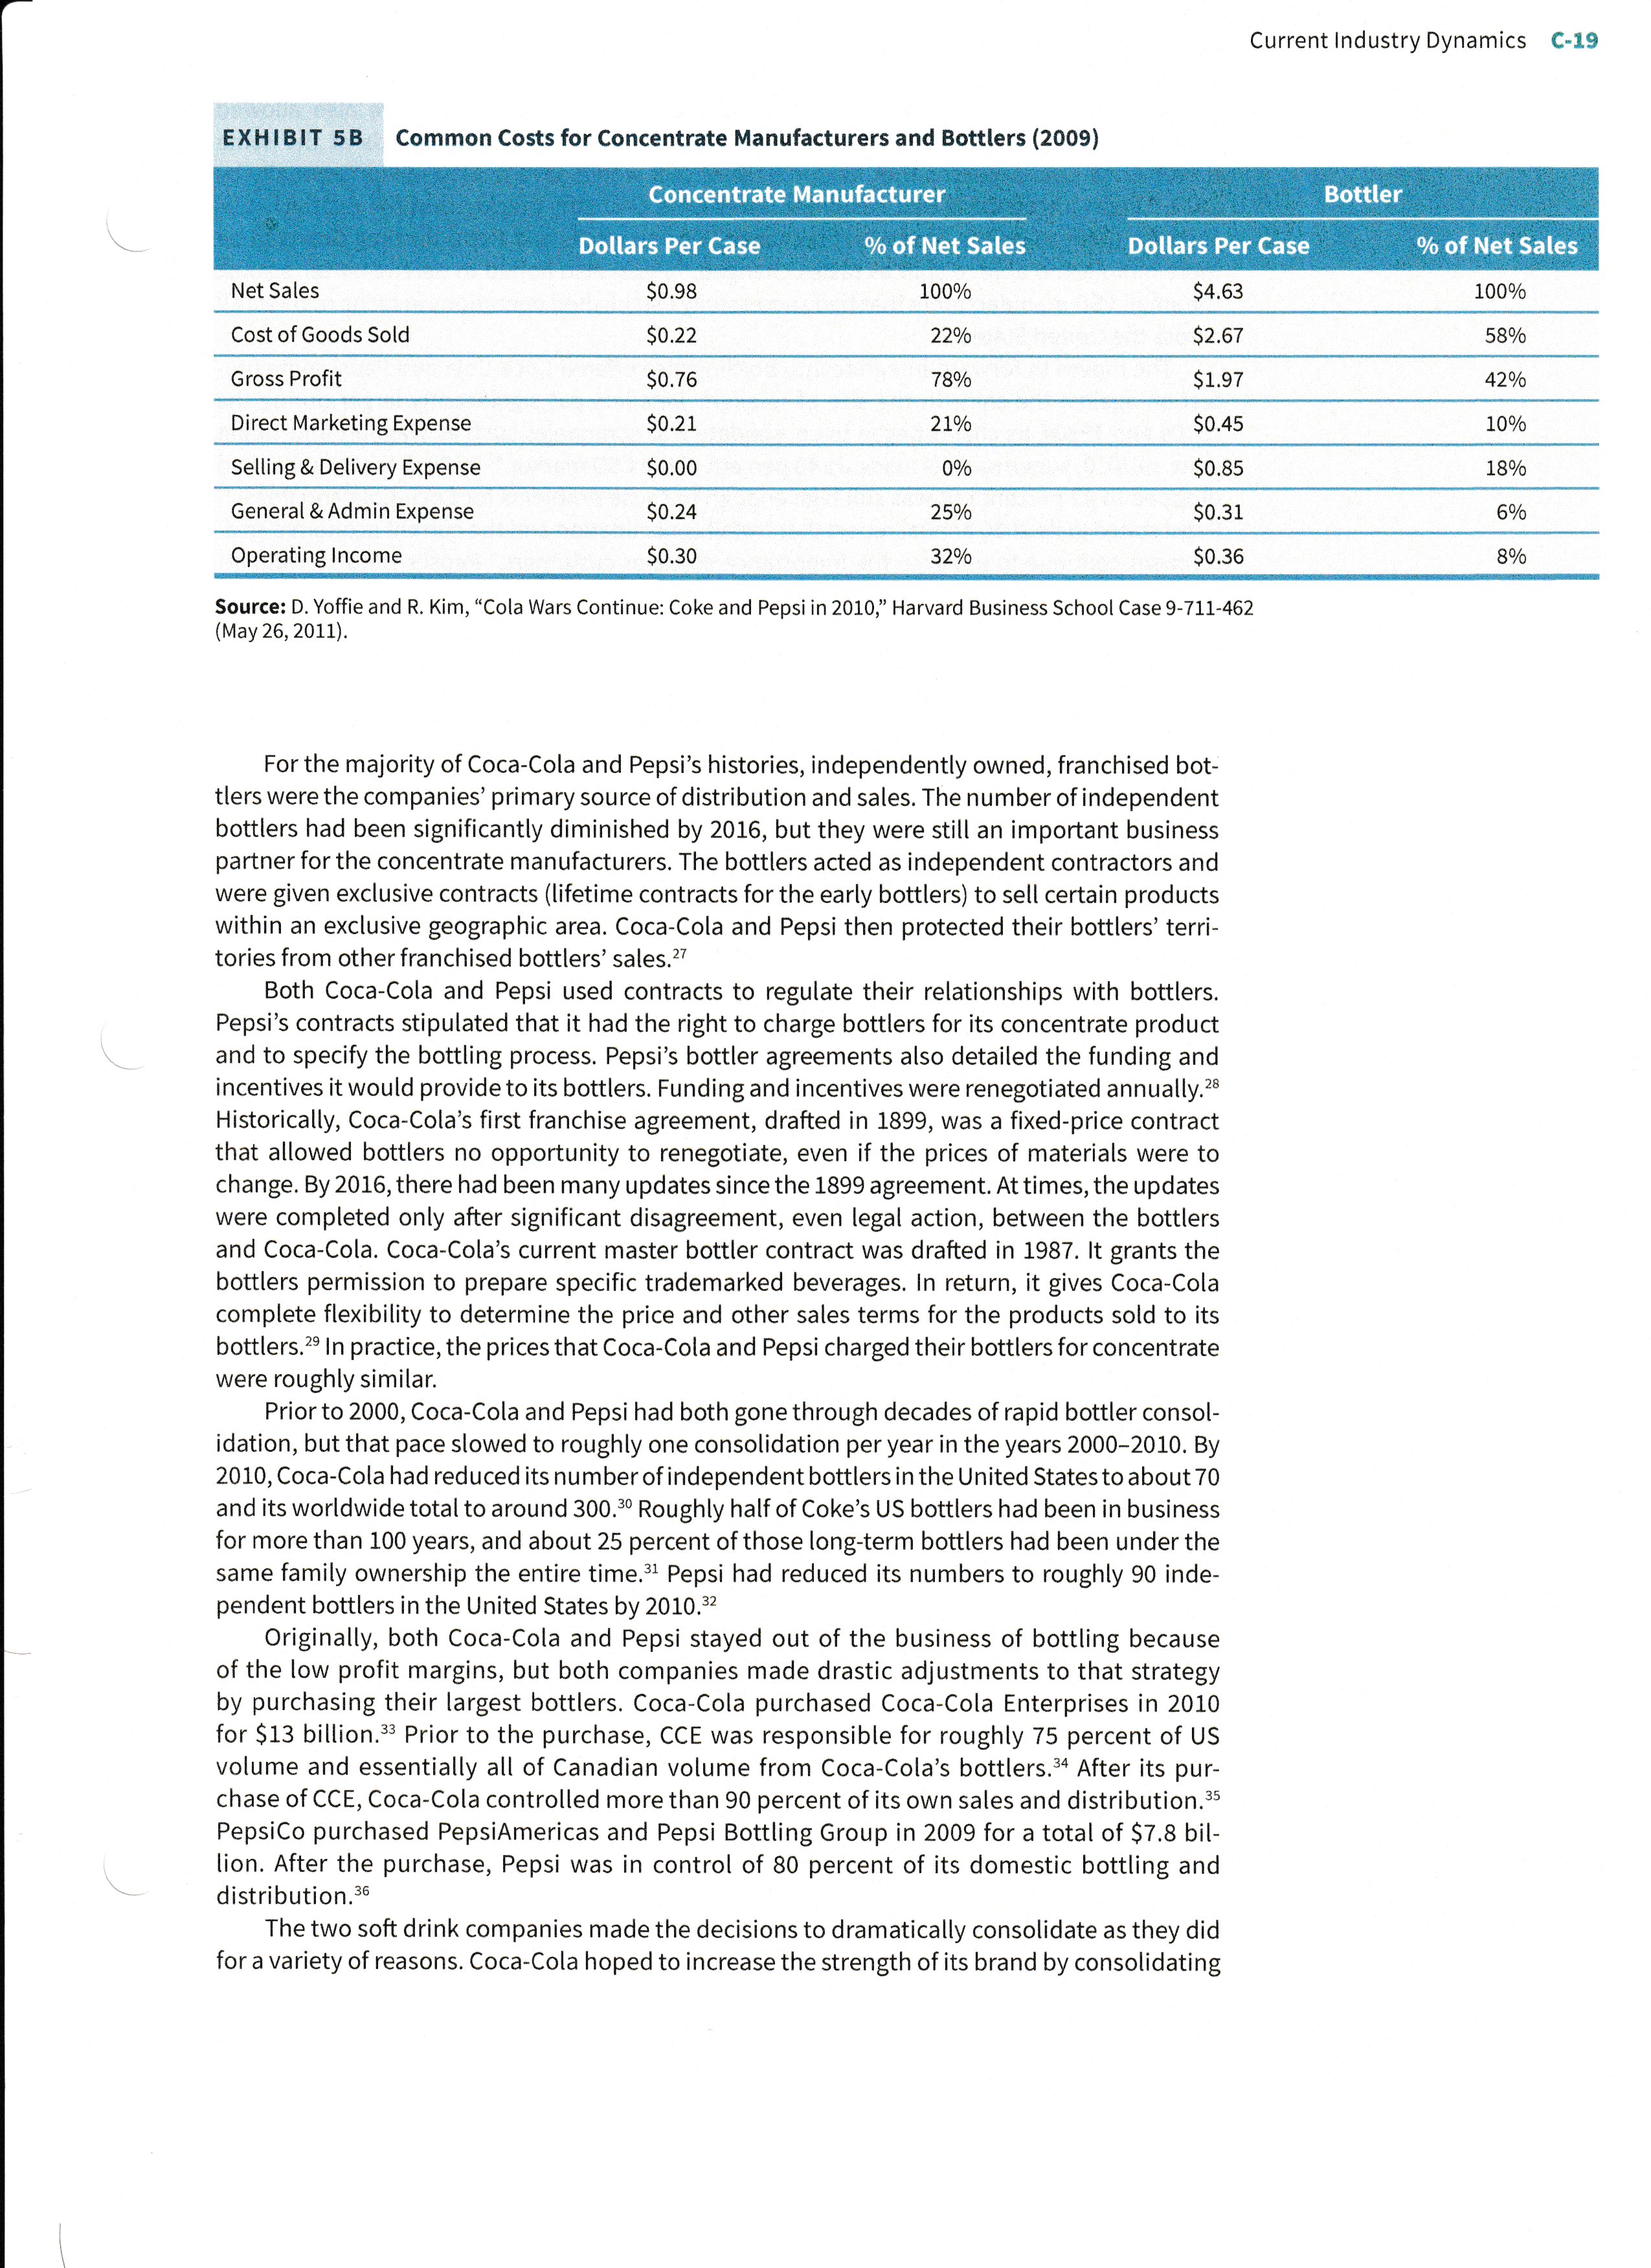
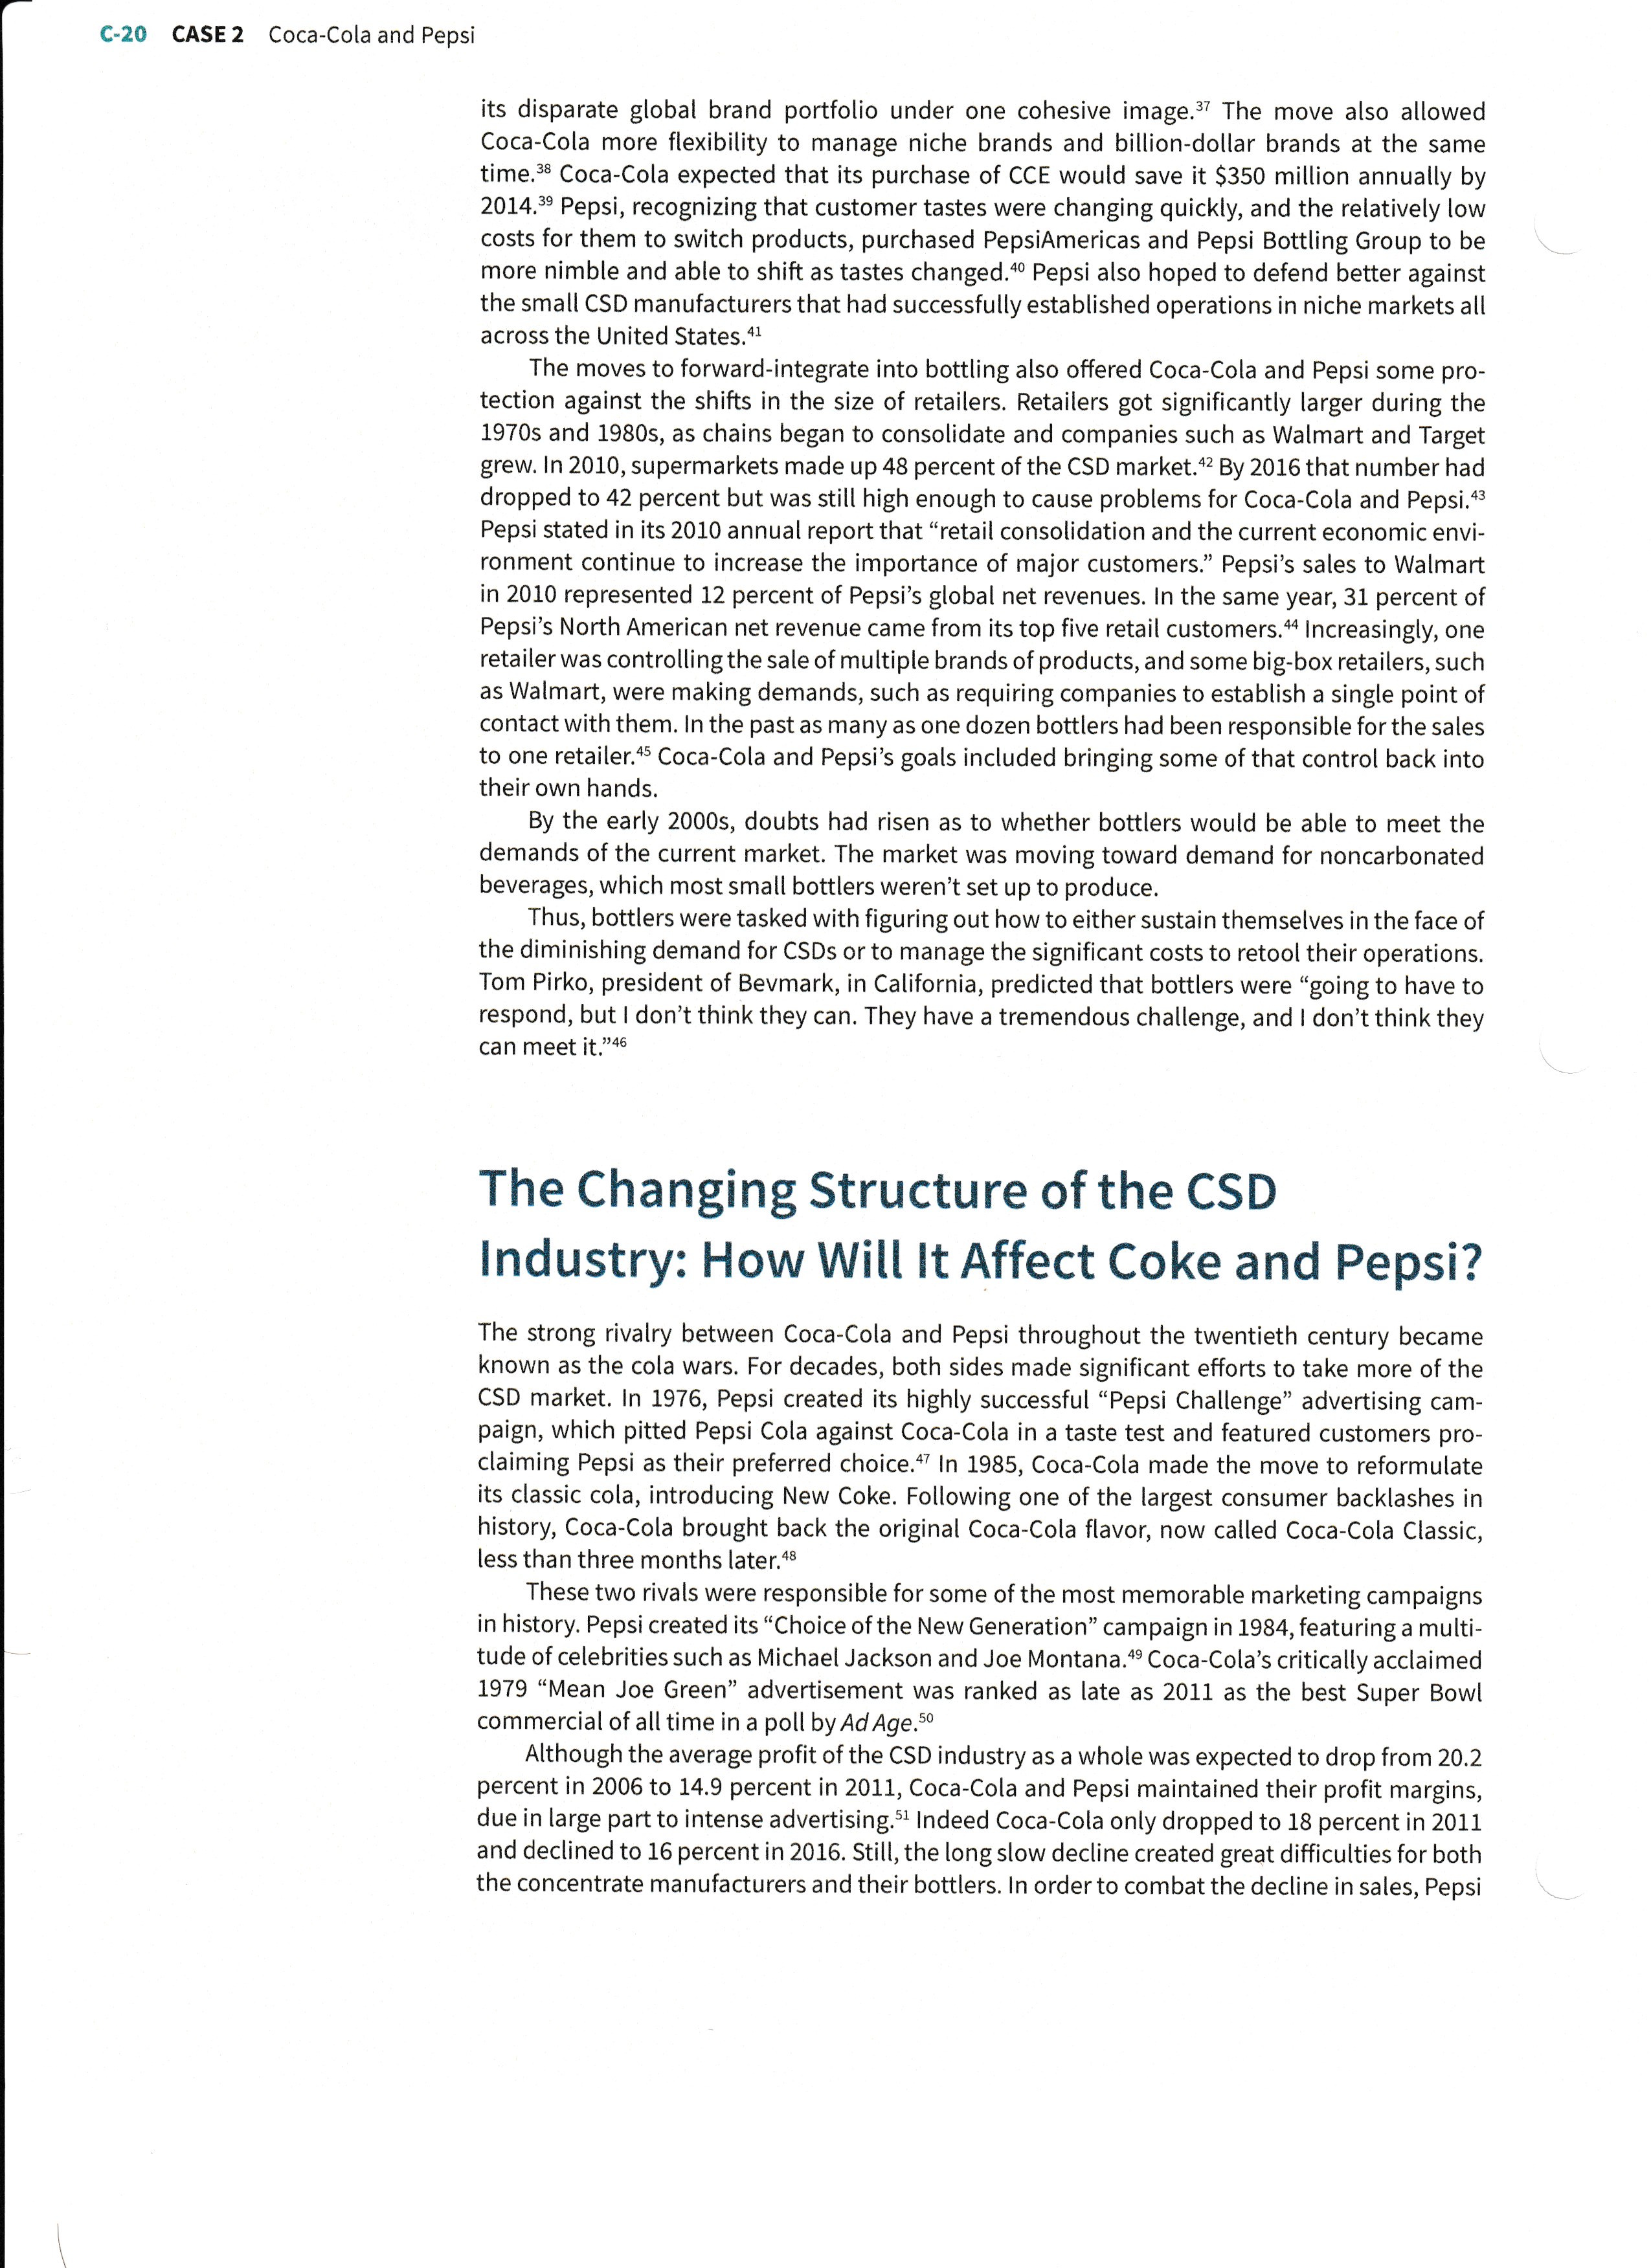
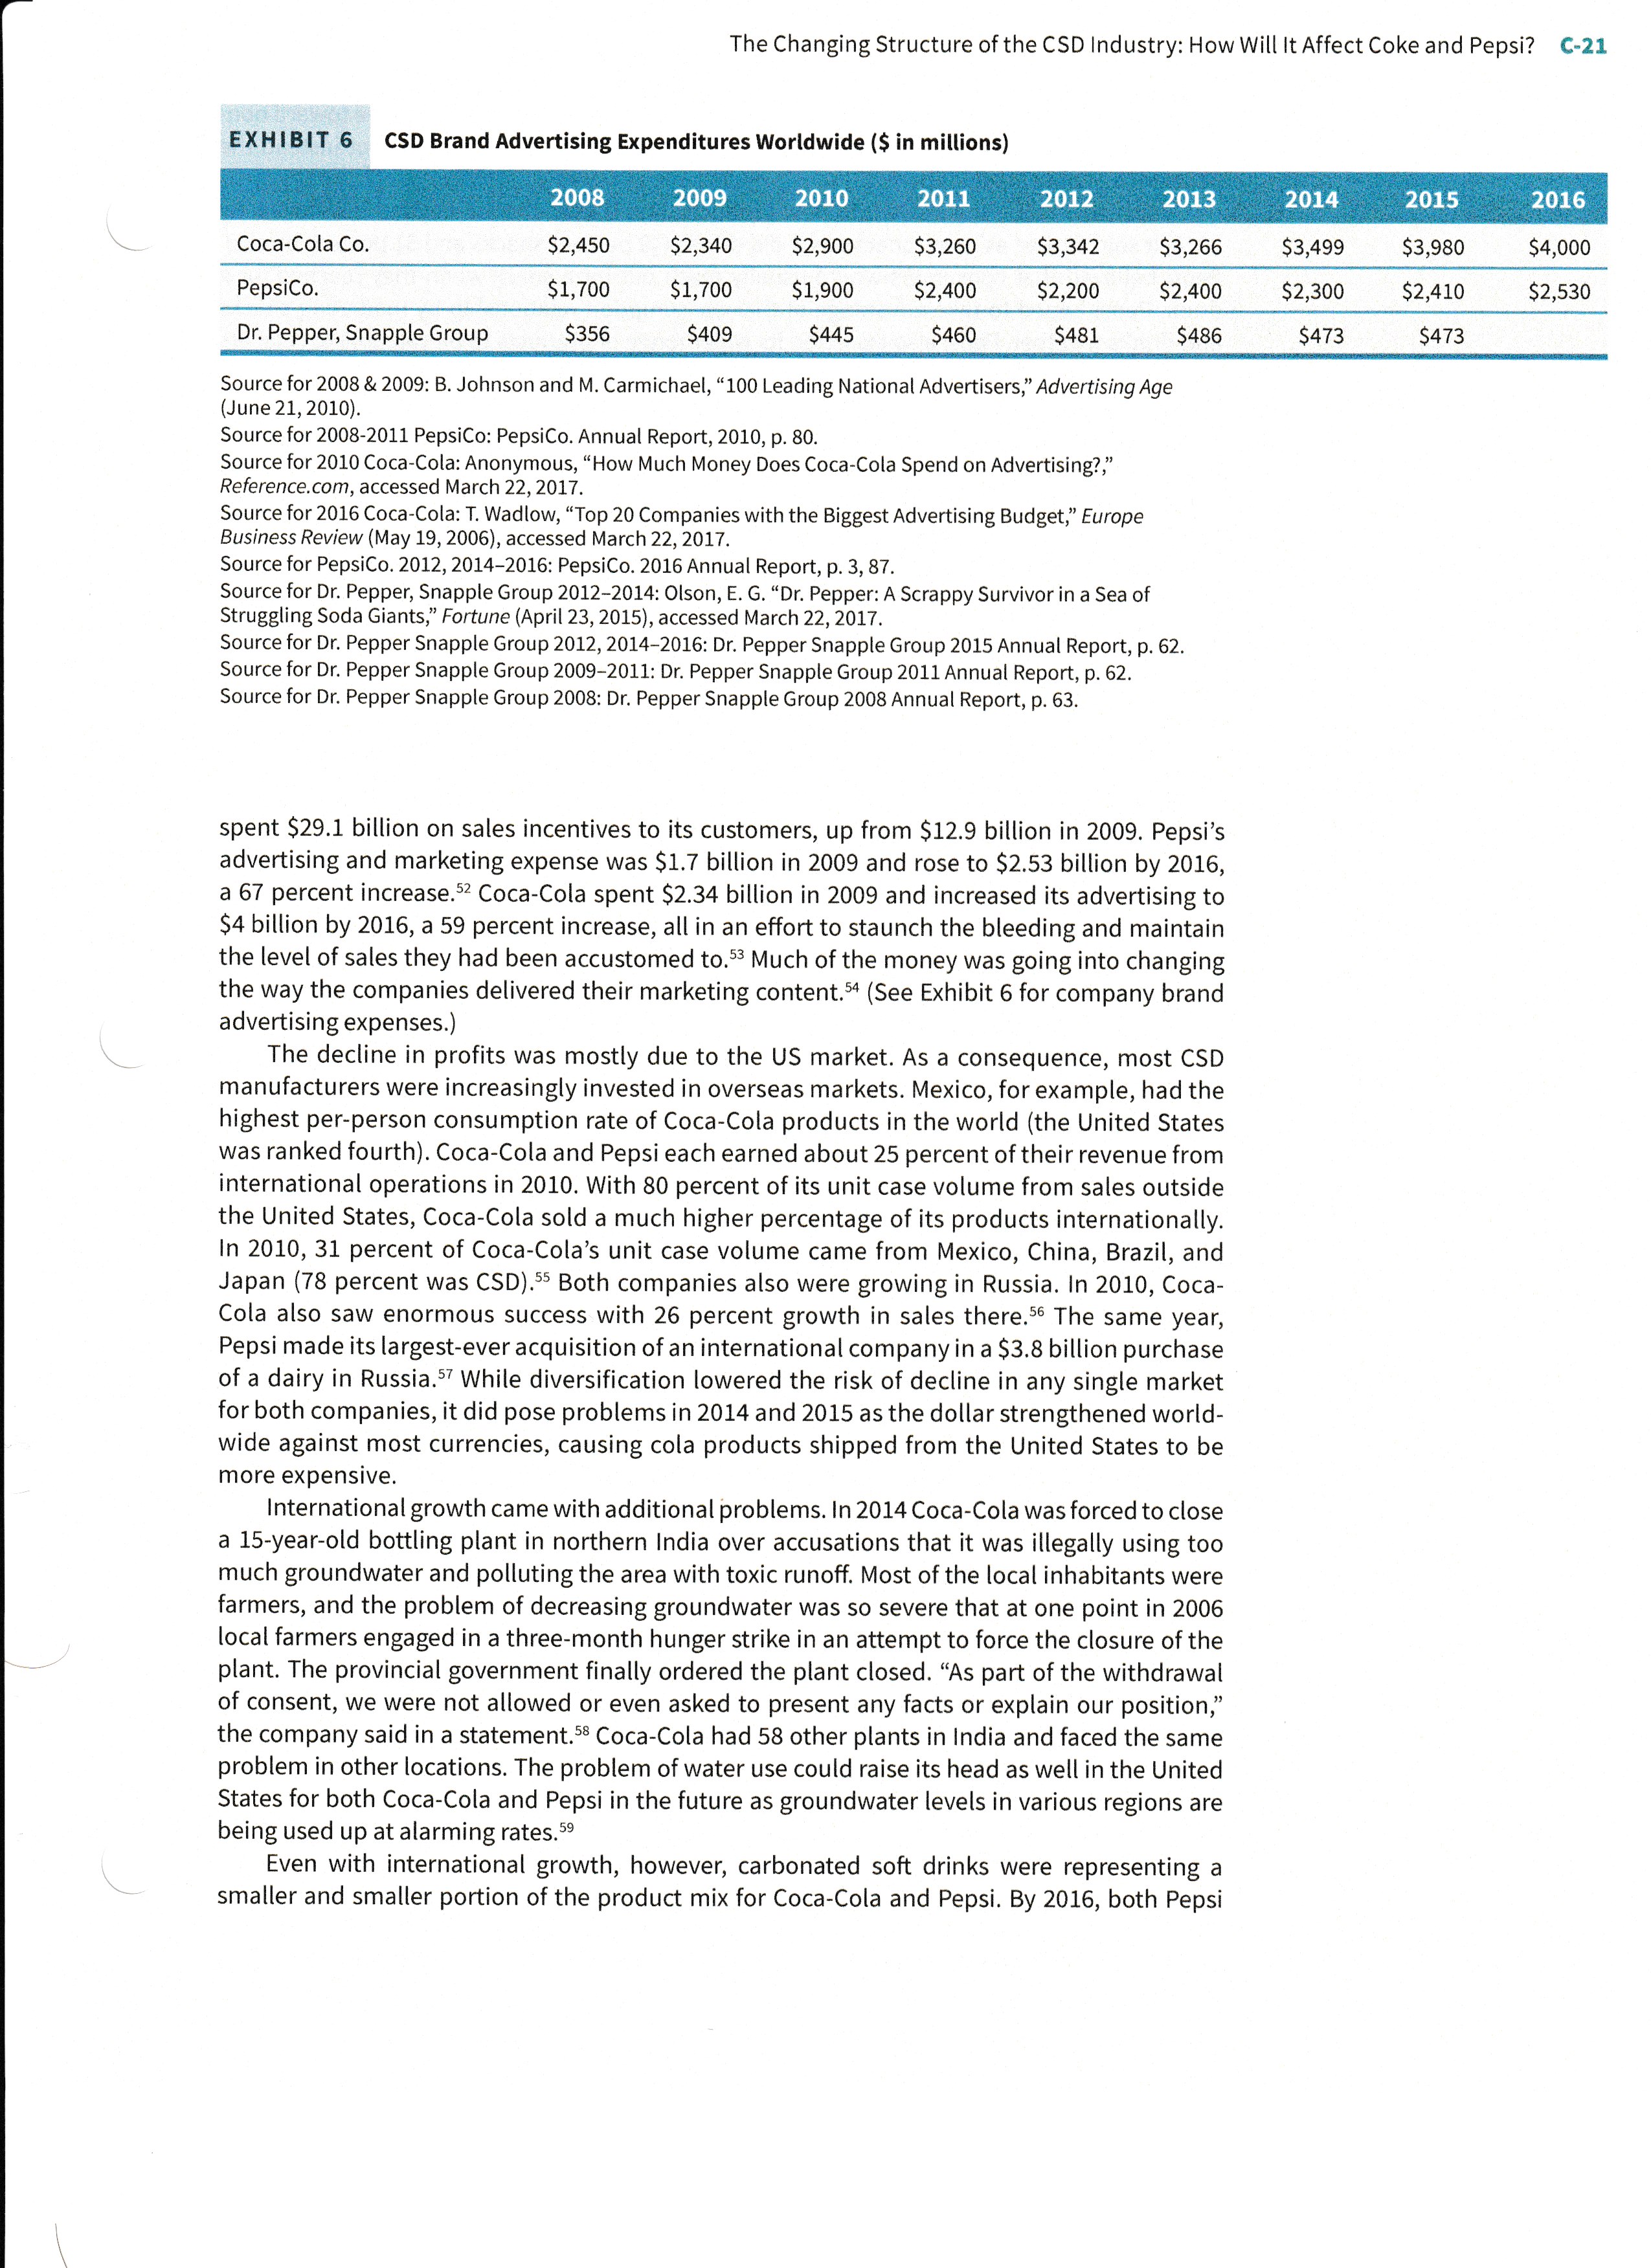
Coca-Cola and Pepsi The Shifting Landscape of the Carbonated Soft Drink Industry Introduction Following 100 years of growth, the carbonated soft drink (CSD) industry was a \$36 billion market (see Exhibit 1), and Coca-Cola and Pepsi had the top selling soft drinks in the world. In 2015, sales of Pepsi and Coca-Cola products made up 70.8 percent of sales in the US CSD industry (see Exhibit 1). The year 2016 marked the 124th anniversary of Coca-Cola. After ten consecutive years as the world's most valuable brand, Coca-Cola slipped for the last five years to number three. 1 Coca-Cola products were sold in more than 200 countries. It had the world's largest beverage distribution system and owned or licensed more than 500 beverage brands. The company estimated that more than 1.7 billion servings of beverages bearing trademarks that it owned or licensed were consumed worldwide every day. Coca-Cola's 140,000 employees worked to generate nearly $42 billion in revenue in 2016,2 and the company had paid an increasing dividend to shareholders for the past 49 consecutive years. 3 Although the Coca-Cola brand was valued at $70 billion and the Pepsi brand was valued at only $14 billion, 4 PepsiCo was the second-largest food and beverage company in the world. It owned or licensed 19 brands that each generated at least $1 billion in annual revenues. Its top brand, Pepsi-Cola, reached over 2 billion in sales in 2016 through retail channels alone. The company's total 2016 revenues were more than $62 billion (see Exhibit 3).. Pepsi employed more than 285,000 people and was listed on both the Forbes and Fast Company lists of the World's Most Innovative Companies in 2011. (See Exhibit 3 for each company's historical revenues.) But the picture was not as rosy as it might appear. The carbonated soft drink market was no longer growing as it had a few decades earlier, during the 1970 s and 1980s. In fact, the CSD market was in decline. Sales of carbonated soft drinks in the largest market, the United States, had been weakening since the turn of the century, declining over 8 percent between 2000 and 2010, with forecasts of continued weak sales (see Exhibit 4). 6 After a small bump in sales in 2011, the industry continued its slow downward slide. 7 This trend continued through 2016, even in the diet soft drink segment of the market, a segment that Coke and Pepsi both thought would be more impervious to changing consumer tastes. From 2012 to 2013, regular soft drink sales dropped 2.2 percent, continuing a trend begun in 2000, while diet drinks plunged 6.8 percent, shaking the confidence of executives in both firms. 8 Entering 2017, Coca-Cola and Pepsi both faced important questions of how to continue their success despite the changes they were facing in the CSD industry. (a) Image (381).jpg () \# O Type here to search ( ) = (@) (0) w - 12C Clear 0 Current Industry Dynamics The carbonated soft drink industry encompasses carbonated, nonalcoholic beverages, including colas and noncola drinks, such as root beer, orange, lemon-lime, and other flavors. Americans consume, year in and year out, more soft drinks than any other category of drinks even with the move toward BFY (better for you) beverages. The CSD Industry saw an annual growth of roughly 10 percent between the early 1970 s and late 1990s. 9 Americans consumed an average of 23 gallons of CSD annually in 1970, and consumption grew by 3 percent per year for the next 30 years. 10 By the early 2000 s, however, attitudes toward soda had begun to change. Americans were down to drinking roughly 46 gallons of CSD per year, significantly less than their consumption levels in the late 1980s. Cola was still the majority of CSD consumption, but it dropped from 71 percent of all CSD in 1990 to 55 percent in 2009.11 US CSD sales further fell by 0.2 percent in 2005, 0.6 percent in 2006, and 2.3 percent in 2007.12 Citing decreasing consumer spending in general and increased consumer preferences for healthier foods, industry analysts expected CSD industry revenues to decline even more, by 2 percent per year from 2011 through 2021.113 Some of the decline in sales is due to the rise of substitute products. Many substitute products are available at varying price points, including water, dairy, juice, coffee, tea, energy drinks, and more (see Exhibits 2A and 2B). Take Red Bull, for instance. Red Bull entered the US soft drinks market in 1997 with a niche product: a carbonated energy drink retailing at \$2 for an 8.3-ounce can-twice what you would pay for a Coke or a Pepsi. The company designed its cans as narrow, tall cylinders, so retailers could stack them in small spaces. It started by selling Red Bull through unconventional outlets such as bars, where bartenders mixed it with alcohol, and nightclubs, where 20-somethings gulped down the caffeine-rich drink so they could dance all night. After gaining a loyal following, Red Bull used the pull of high margins to elbow its way into the corner store, where it now sits in refrigerated bins within arm's length of Coke and Pepsi. In the United States, where Red Bull enjoyed the highest market share of the $12 billion energy drink market in 2015, its sales are growing at about 35 percent a year. Red Bull is privately held, but all the signs suggest that it's profitable. Although substitutes have taken a large bite out of Coca-Cola and Pepsi's profits, companies trying to directly enter the CSD market haven't been as successful. For instance, in 1998, Virgin Drinks launched its own cola, advertising heavily and trying to get into all the retail outlets that stocked the leading brands. At Virgin Cola's US launch, Virgin Group CEO Richard Branson drove a tank through a wall of cans in New York's Times Square to symbolize the war he wished to wage on Coca-Cola and Pepsi. However, the leaders' viselike grip on shelf space in grocery stores and other retail outlets proved impossible for Virgin Drinks to break. In July 2000 , the company's marketing vice president admitted to a trade publication that "There are people who are saying, 'We've been looking for years, and we can't find it [Virgin Cola].' "Virgin Drinks was never able to garner more than a 1 percent share of the US cola market. For both new entrants and established firms such as Coca-Cola and Pepsi, the process of CSD production is similar. It essentially involves combining raw ingredients and packaging for shipment to its buyers. Participants in the process include raw material suppliers; manufacturers of concentrates-flavor syrups not yet diluted with carbonated water-who purchase some raw materials; bottlers, who purchase concentrate and additional raw materials; and retailers. Concentrate manufacturers and bottlers are the two major players during the production process. Coca-Cola and Pepsi as Concentrate Manufacturers At the heart of each company are its concentrate manufacturing plants, where raw materials are blended, packaged into containers, and then shipped ready for bottling. 14 The raw materials used in producing concentrate are highly guarded secrets for each company, but they primarily consist of commodity ingredients such as citric acid, caffeine, and caramel coloring. Concentrate manufacturers typically add artificial sweetener to concentrates for EXHIBIT2A Selected US Nonalcoholic Beverage Segment Sales (At Current Prices, in Millions; overall market includes CSDs and is in millions to be comparable to segments) Source: Based on Information Resources Inc., InfoScan Reviews; USDA Economic Research Service; CSPnet "Category Management Handbook"; SPINS; BevNet; US Census Bureau, Economic Census/Mintel. EXHBIT 2B MULO sales of 100% juice, juice drinks, and smoothies, by leading companies, 52 weeks ending May 15, 2016 Source: Information Resources, Inc., InfoScan Reviews/Mintel. diet products and sell concentrates for "regular" soft drinks to bottlers unsweetened, so that bottlers can add sweeteners, such as sugar or high-fructose corn syrup, during the bottling process. Financial Data for Coca-Cola and Pepsi source: coca-cola co. annual statements. sunice. repsilu. ailluat slatemtells. EXHIBIT 4 US Carbonated Soft Drink Pricing Source: Beverage Digest Fact Book editions 2001, 2006, 2007, 2008, 2009, and 2010. The concentrates are typically priced at a high margin above the cost of the raw materials. 15 The primary customers of the concentrate manufacturer were originally its franchised bottlers. Bottlers are still the largest group of buyers, but by the late 1990s, that customer base had expanded to include wholesale distributors, grocery stores, mass merchandisers, and hotels and restaurants. Fountain syrups, which are dispensed directly into a consumer's cup from a fountain machine, are also typically produced by the concentrate manufacturer and then delivered directly to a fountain wholesaler or to the fountain location. 16 The largest costs for CSD manufacturers, including Coca-Cola and Pepsi, were advertising, promotional materials, market research, and support for bottlers, including local advertising and negotiating with the bottler's raw material suppliers and their primary customers, retail stores. In 2017, the concentrate manufacturer was primarily responsible for product development and innovation, as well as concentrate production. CSDs were differentiated through branding that was strengthened by heavy advertising..17 The concentrate manufacturers also made significant investments into protecting their trademarks and supported their bottlers by working out agreements for shelf space with major retailers, such as Walmart. In addition, Coca-Cola and Pepsi provided financial incentives to their customers for promotion and distribution of the products, including volume rebates, product placement fees, and investment in displays. Although they provided little in the way of price concessions to bottlers, both Pepsi and Coca-Cola offered considerable product discounts and promotional payments, particularly to fountain accounts. Fountain accounts are companies that distributed CSD products through fountains (mixing concentrate and carbonated water on the spot) rather than in cans or bottles. Restaurant chains, such as McDonald's or Burger King, were important fountain customers. In 2010, Pepsi and Coca-Cola respectively recorded $29 billion and $5 billion of such incentives as reductions in revenues. 18 Coca-Cola and Pepsi conducted numerous transactions with their bottlers, which included the sale of both concentrate and finished goods to be distributed. The companies received royalties for the use of trademarks on certain products, such as charging a bottler to use Pepsi's Aquafina brand of bottled water. 19 While the majority of fountain accounts were serviced by the concentrate manufacturer, some bottlers were paid fees to distribute products to fountain accounts. Coca-Cola serviced almost all of its international fountain accounts through bottlers. 20 Pepsi had costs of $3.922 billion in 2009 and $4.049 billion in 2010 due to such transactions. 21 Coca-Cola paid nearly $540 million to its largest bottler for marketing support in 2008. 22 The State of the Bottling Industry: The Primary Customer for Concentrate Manufacturers CSD bottlers purchase concentrate from the manufacturers, add sweetener and carbon dioxide, and then package the mixture into bottles or cans. Raw materials for bottlers include concentrate, sweetener, PET resin (to make plastic bottles), aluminum and steel for cans, packaging, labels, cartons, cases, and carbon dioxide. Because the cost of transporting beverages is relatively high compared to the product value, Coke and Pepsi placed bottling plants in various locations throughout the markets they served. 23 Such placement of bottlers gave both Coca-Cola and Pepsi the ability to market to a very broad audience, while maintaining a localized approach. Bottlers were responsible for local marketing and customer interactions. Bottler salespeople secured shelf space, positioned trademarks, and set up displays at the ends of supermarket aisles. The bottler was also responsible for developing the shelf-space agreements with small retailers. Bottling plants are far more capital-intensive than concentrate-manufacturing plants. A concentrate plant with the capacity to serve the entire United States would cost somewhere between $50 million and $100 million. A typical bottling plant could cost hundreds of millions; a single bottling line costs between $4 million and $10 million to build..24ln2008, the Dr. Pepper Snapple Group, a competitor of both Coca-Cola and Pepsi, opened a plant with a capacity of 40 million cases per year, enough to service California and some Southwestern markets, at a cost C-18 CASE 2 Coca-Cola and Pepsi of $120 million. 25 For every dollar that a bottler spends on labor, roughly 30 cents is spent on capital. Although Coca-Cola and Pepsi's largest bottlers took in considerable revenue, margins were significantly lower than they were for concentrate manufacturers. (See Exhibits 5A, 5B, and 6.) Given that the CSD market was relatively mature, bottlers sought cost advantages, and bottler capital intensity was thus expected to increase for the foreseeable future. 26 EXHIBIT 5 A Financial Data for Coca-Cola and Pepsi's Largest Bottlers Prior to and After Mergers Source: Coca-Cola Bottling Co. consolidated annual statements. PepsiCo. bought Pepsi Bottling Group in late 2009. From 2010 the Income Statements are merged for the PepsiCo. and the Pepsi Bottling Group. Source: Pepsi Bottling Group, Annual Statements. Current Industry Dynamics C-19 EXHIBIT 5 B Common Costs for Concentrate Manufacturers and Bottlers (2009) Source: D. Yoffie and R. Kim, "Cola Wars Continue: Coke and Pepsi in 2010," Harvard Business School Case 9-711-462 (May 26, 2011). For the majority of Coca-Cola and Pepsi's histories, independently owned, franchised bottlers were the companies' primary source of distribution and sales. The number of independent bottlers had been significantly diminished by 2016, but they were still an important business partner for the concentrate manufacturers. The bottlers acted as independent contractors and were given exclusive contracts (lifetime contracts for the early bottlers) to sell certain products within an exclusive geographic area. Coca-Cola and Pepsi then protected their bottlers' territories from other franchised bottlers' sales..27 Both Coca-Cola and Pepsi used contracts to regulate their relationships with bottlers. Pepsi's contracts stipulated that it had the right to charge bottlers for its concentrate product and to specify the bottling process. Pepsi's bottler agreements also detailed the funding and incentives it would provide to its bottlers. Funding and incentives were renegotiated annually. 28 Historically, Coca-Cola's first franchise agreement, drafted in 1899, was a fixed-price contract that allowed bottlers no opportunity to renegotiate, even if the prices of materials were to change. By 2016, there had been many updates since the 1899 agreement. At times, the updates were completed only after significant disagreement, even legal action, between the bottlers and Coca-Cola. Coca-Cola's current master bottler contract was drafted in 1987. It grants the bottlers permission to prepare specific trademarked beverages. In return, it gives Coca-Cola complete flexibility to determine the price and other sales terms for the products sold to its bottlers. 29 In practice, the prices that Coca-Cola and Pepsi charged their bottlers for concentrate were roughly similar. Prior to 2000, Coca-Cola and Pepsi had both gone through decades of rapid bottler consolidation, but that pace slowed to roughly one consolidation per year in the years 2000-2010. By 2010, Coca-Cola had reduced its number of independent bottlers in the United States to about 70 and its worldwide total to around 300.30 Roughly half of Coke's US bottlers had been in business for more than 100 years, and about 25 percent of those long-term bottlers had been under the same family ownership the entire time. 31 Pepsi had reduced its numbers to roughly 90 independent bottlers in the United States by 2010.32 Originally, both Coca-Cola and Pepsi stayed out of the business of bottling because of the low profit margins, but both companies made drastic adjustments to that strategy by purchasing their largest bottlers. Coca-Cola purchased Coca-Cola Enterprises in 2010 for $13 billion. 33 Prior to the purchase, CCE was responsible for roughly 75 percent of US volume and essentially all of Canadian volume from Coca-Cola's bottlers. 34 After its purchase of CCE, Coca-Cola controlled more than 90 percent of its own sales and distribution. 35 PepsiCo purchased PepsiAmericas and Pepsi Bottling Group in 2009 for a total of $7.8 billion. After the purchase, Pepsi was in control of 80 percent of its domestic bottling and distribution..36 The two soft drink companies made the decisions to dramatically consolidate as they did for a variety of reasons. Coca-Cola hoped to increase the strength of its brand by consolidating and Coca-Cola had expanded to extensive juice lines and were continuing to move toward nonCSD drinks. Coca-Cola's most recent billion-dollar brand was not a new CSD but instead the juice drink Minute Maid Pulpy. 60 Pepsi also made the move into new products, and it even moved beyond beverages. By 2010, it sold almost as many snacks as it did drinks (49 percent snacks and 51 percent drinks). Pepsi believed that consumers would usually reach out for a snack when they reached for a drink. Pepsi hoped to take advantage of that consumption relationship by marketing snacks and drinks together. Pepsi also expected its wider range of products to be valuable to retailers and hoped that offering a wider range of products would better keep consumers within its brand portfolio as they inevitably switched preferences. CSDs had faced significant pressure as consumer interest in healthier drinks had led to a number of new companies entering the beverage market. While the CSD market was contracting, the overall beverage market was expanding by about 0.7 percent per year. On top of that, many state governments were seeking restrictions on the sale of CSDs to children at school. 61 This was no small problem for carbonated soft drinks. People throughout the United States were turning to healthier options. And many were wondering if sugary soft drinks were part of the problem, particularly with children (see Exhibit 7)..2 Pepsi's response was to make limiting such distribution and the production of healthier foods part of its core values. (See Exhibits 2A and 2B for beverage sales trends.) Pepsi had broken its portfolio of products up into "Fun-For-You," "Better-For-You," and "Good-For-You" categories. In 2010, more than 15 percent of its revenues came from nutrition products, 63 and Pepsi hoped to expand and take a large share of the $500 billion packaged-nutrition market by moving its product mix further toward "Good-For-You" foods. 64 In contrast, Coca-Cola's CEO, Muhtar Kent, admitted in 2009 that the company had "missed the boat" a bit by not recognizing earlier the changes that were happening in the market. Kent stated, "There was a period when our company did lose its way. We were too internally focused and not focused enough on the changes taking place with our consumers and customers. In essence, we were too busy looking at the dashboard and not sufficiently paying attention to the world outside our windshield." In response, Coca-Cola developed its 2020 Vision Plan, which stated that, by the year 2020, Coca-Cola would increase total revenues to $200 billion, increase the number of servings of its products consumed every day to 3 billion, and, specifically, get away from the cola war to focus on the changing consumer. 65 The year over year decline in all carbonated soft drinks, not just Coca-Cola's, made this vision nearly impossible. By 2016 Coca-Cola earned revenues of $41.9 billion, a long, long way from the goal of $200 billion. In fact, Coca-Cola and Pepsi both stated that they no longer found the rivalry between the two companies relevant to their strategic goals. The difference in directions was emphasized 27 Coca-Cola Company, Coca-Cola Co. 10-K 2010; PepsiCo, Annual Report, 2010. 28 PepsiCo, Annual Report, 2010. 29Coca Cola Company, Coca Cola Co. 10-K, 2010. 30 Coca-Cola Company, "The Coca-Cola System," available at http:// www.thecoca-colacompany.com/ourcompany/the_cocacola_system .html, September 26, 2014. 31J. McWilliams, "Coke's New Chapter Puts Light on Bottlers," The Atlanta Journal-Constitution (October 12, 2010), Business section. 32 A. Tse, "Best in Class: Pepsi Takes on the World (Part 2)," The Street (July 20, 2010), Consumer Goods section. "33" Coca Cola to Buy Big Stake in CCE," Atlanta Business Chronicle (February 24, 2010), Retailing \& Restaurants section. 34CocaColaCompany,AnnualReview,2010. 35M. Russell, "In the Spotlight: Coca-Cola Co and Coca-Cola Enterprises Deal Closes," Just-Drinks.com (October 6, 2010). 36 N. Byrnes, "Pepsi Gets Back into Bottling," Bloomberg Businessweek (August 4, 2009). 37 Coca-Cola Company, Annual Review, 2010. 38 Russell. 39CocaColaCompany,AnnualReview,2010. 40 Tse. 41 Kaczanowska. 42Ibid. 43 Information Resources, Inc., InfoScan Reviews/Mintel, "Carbonated Soft Drinks - US - June 2016, Appendix - Market 4." 44 PepsiCo, Annual Report, 2010. 45 McWilliams. 46 Ibid. 47 PepsiCo, The Pepsi-Cola Story (2005), http://www.pepsi.com /Pepsilegacy_Book.pdf. 48 M. E. Ross, "It Seemed Like a Good Idea at the Time: New Coke 20 Years Later and Other Marketing Fiascoes," MSNBC.com (April 22, 2005), U.S. News section, available at http://www.msnbc.msn.com/id/7209828/ ns/us_news/t/it-seemed-good-idea-time/\#.Tr6R6cOy6wg. 49 PepsiCo, The Pepsi-Cola Story. 50"Coke's Mean Joe Greene vs. Apple's '1984' Face Off for Super Bowl Championship," Advertising Age (February 3, 2011), available at http://adage.com/article/special-report-super-bowl/joe-green-1984super-bowl-commercial-title/148635/. 51Kaczanowska. 52 PepsiCo, Annual Report, 2010. 53 Coca-Cola Company, Coca-Cola Co. 10-K 2010, 2010. 54N. Zmuda, "Coca-Cola Lays Out Its Vision for the Future at 2010 Meeting," Advertising Age (November 22, 2009). 55 Coca-Cola Company, Coca-Cola Co. 10-K 2010, 2010. 56CocaColaCompany,AnnualReview,2010. 57 PepsiCo, Pepsi Milestones 2010, 2010, available at http://www.pepsico .com/Download/PepsiCo_Recent_Milestones.pdf. 58 Anonymous. "Coca-Cola Forced to Close India Bottling Factory Over Excessive Water Use, Pollution," RT (June 19, 2014), http://rt.com ews/167012-coca-cola-factory-closed-india/. 59B. Plumer, "How Long Before the Great Plains Runs Out of Water?" Washington Post (September 12, 2013), http://www.washingtonpost .com/blogs/wonkblog/wp/2013/09/12/how-long-before-the-midwest -runs-out-of-water/. 60 Coca-Cola Company, Annual Review, 2010. 61 Kaczanowska. 62 V. S. Malik, W. C. Willett, and F. B. Hu, "Sugar-Sweetened Beverages and BMI in Children and Adolescents: Reanalyses of a Meta-analysis," American Journal of Clinical Nutrition 89 (2009): 438-439, author reply 9-40. 63 Tse. 64 PepsiCo, Annual Report, 2010. 65Zmuda. 66 Ibid 67 Tse. 68 PepsiCo, Annual Report, 2010. 69 Esterl. 70 La Monica, P.R. "No Loser in Cola Wars. Coke \& Pepsi Thriving," CNN Money (April 12, 2016), accessed March 22, 2017
Step by Step Solution
There are 3 Steps involved in it

Get step-by-step solutions from verified subject matter experts