

Question: Case 4 (6 marks): The following table shows the expected return for each of the 3 stocks. It also shows the set risk level of
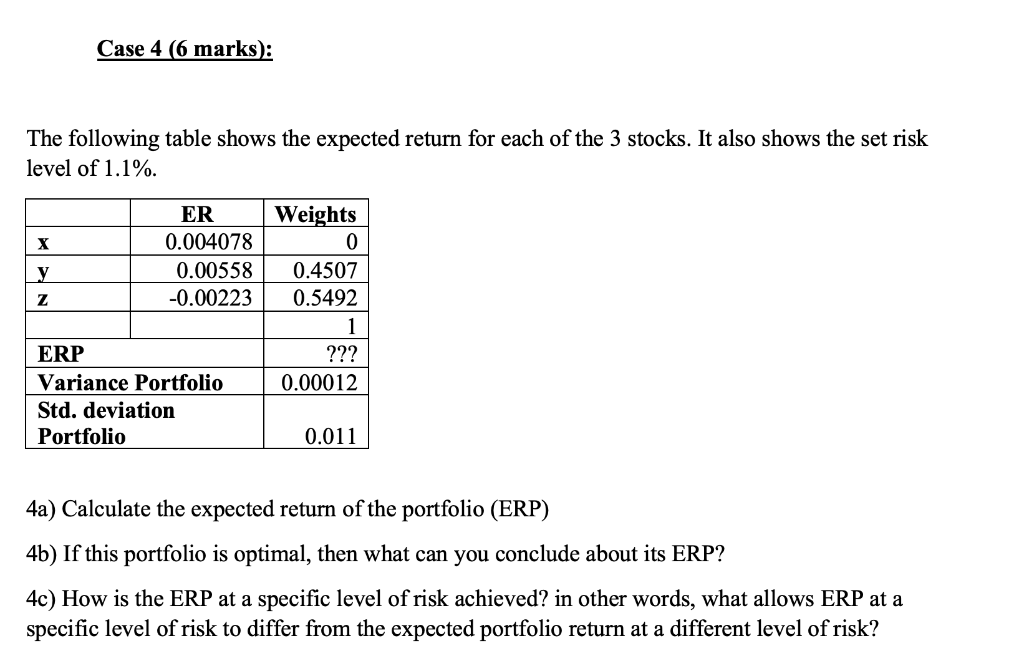
Case 4 (6 marks): The following table shows the expected return for each of the 3 stocks. It also shows the set risk level of 1.1%. ER 0.004078 Weights 0 0.00558 -0.00223 Z 0.4507 0.5492 1 ??? ERP 0.00012 Variance Portfolio Std. deviation Portfolio 0.011 4a) Calculate the expected return of the portfolio (ERP) 4b) If this portfolio is optimal, then what can you conclude about its ERP? 4c) How is the ERP at a specific level of risk achieved? in other words, what allows ERP at a specific level of risk to differ from the expected portfolio return at a different level of risk
Step by Step Solution
There are 3 Steps involved in it
1 Expert Approved Answer
Step: 1 Unlock

Question Has Been Solved by an Expert!
Get step-by-step solutions from verified subject matter experts
Step: 2 Unlock
Step: 3 Unlock