Question: Case example Game-changing forces and the global advertising industry Peter Cardwell This case is centred on the global advertising industry which faces significant strategic game-changing
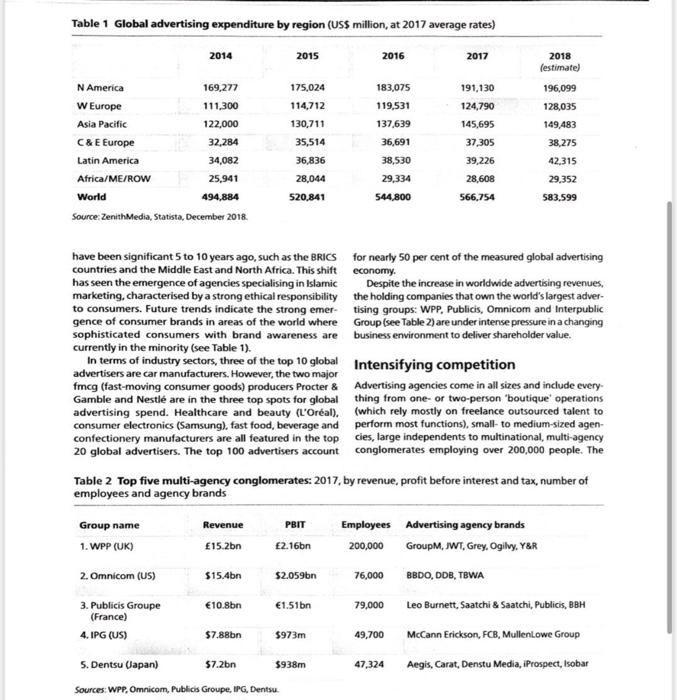
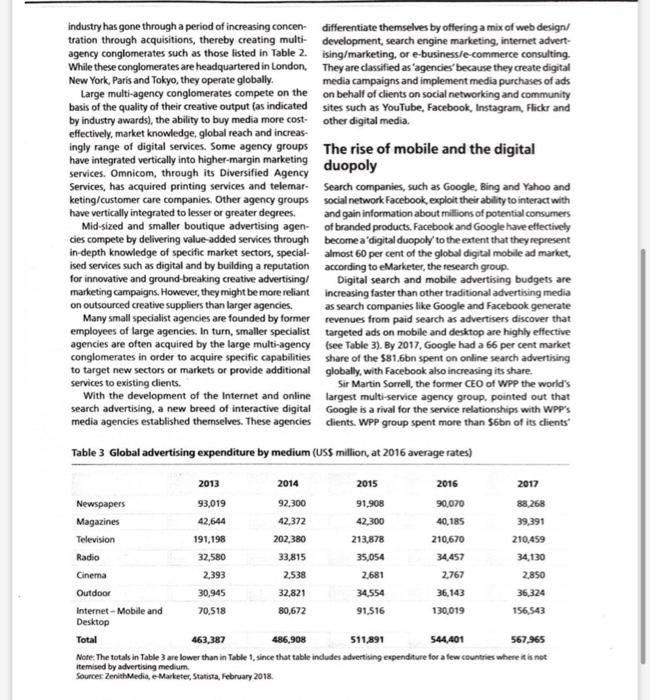
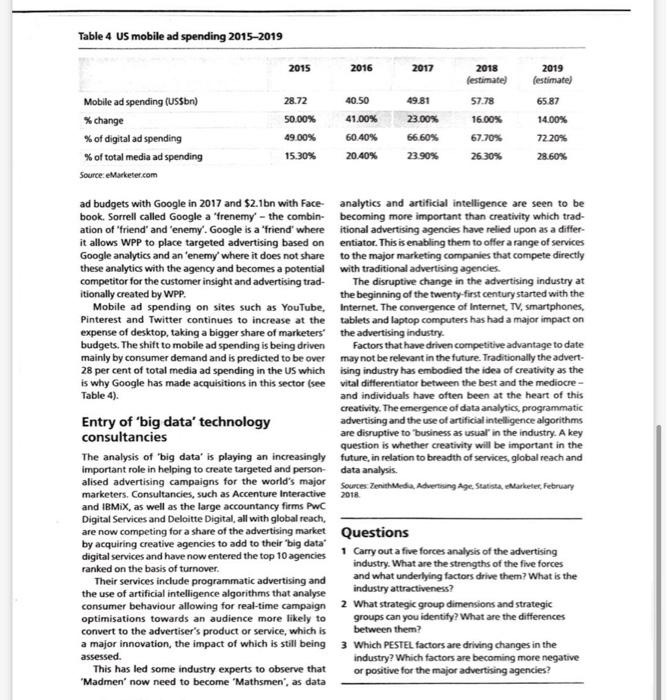
Case example Game-changing forces and the global advertising industry Peter Cardwell This case is centred on the global advertising industry which faces significant strategic game-changing forces driven by technological innovation, the rise of consumer spending in developing economies, changes in consumer media consumption and pressures from major advertisers for results-based compensation In the second decade of the new millennium, advertising agencies faced a number of unanticipated challenges. Traditional markets and industry operating methods, developed largely in North America and Western Europe following the rise of consumer spending power in the twentieth century, were being radically reappraised. Google Ads Overview Click Through Rate & Impressions by Clicks, CTR, and impressions Olcs 0.0 0.0% 0.0 Source: Pixie/Shutterstock The industry was subject to game-changing forces from the so-called 'digital revolution with the entry of search companies like Google, Facebook and Amazon as rivals for advertising budgets on mobile devices. Changing patterns in global consumer markets impacted on both industry dynamics and structure. Budgets being spent through traditional advertising agencies were being squeezed as industry rivalry intensified with the entry of specialist consultancies. Overview Traditionally, the business objective of advertising agen cies is to target a specific audience on behalf of clients with a message that encourages them to try a product or service and ultimately purchase it. This is done largely through the concept of a brand being communicated via media channels. Brands allow consumers to differen- tiate between products and services and it is the job of the advertising agency to position the brand so that it is associated with functions and attributes which are valued by target consumers. These brands may be consumer brands (e.g. Procter & Gamble, Samsung, Nestle) or business-to-business (828) brands (eg. IBM, Airbus Indus- trie and UPS). Some brands target both consumers and businesses (eg. Microsoft and Apple). As well as private-sector brand companies, govern- ments spend heavily to advertise public sector services such as healthcare and education or to influence indi- vidual behaviour (such as "Don't drink and drive'). For example, the UK government had an advertising budget of 300m (335m) in the late-2010s. Charities, political groups, religious groups and other not-for-profit organ- isations also use the advertising industry to attract funds into their organisation or to raise awareness of issues. Together these account for approximately 3 per cent of advertising spend. Advertisements are usually placed in selected media (TV, press, radio, mobile and desktop internet, etc.) by an advertising agency acting on behalf of the client brand company, thus they are acting as 'agents. The client company employs the advertising agency to use its know- ledge, skills, creativity and experience to create advert- ising and marketing to drive consumption of the client's brands. Clients traditionally have been charged according to the time spent on creating the advertisements plus a commission based on the media and services bought on behalf of dients. However, in recent years, larger advert- isers such as Coca-Cola, Procter & Gamble and Unilever have been moving away from this compensation model to a 'value' or results-based model based on a number of metrics, including growth in sales and market share Ad industry growth Money spent on advertising has increased dramatic- ally over the past two decades and in 2018 was over $205billion (176bn, 158bn) in the USA and $583 billion worldwide. While there might be a decline in recessionary years, it is predicted that spending on advertising will exceed $787 billion globally by 2022. The industry is shifting its focus as emerging markets drive revenues from geographic sectors that would not - Table 1 Global advertising expenditure by region (US$ million, at 2017 average rates) 2014 2015 2016 2017 2018 (estimate) N America 169,277 175,024 183,075 191,130 196,099 W Europe 111,300 114,712 119,531 124,790 128,035 Asia Pacific 122,000 130,711 137,639 145,695 149,483 C & E Europe 32,284 35,514 36,691 37,305 38,275 Latin America 34,082 36,836 38,530 39,226 42,315 Africa/ME/ROW 25,941 28,044 29,334 28,608 29,352 World 494,884 520,841 544,800 566,754 583,599 Source: ZenithMedia, Statista, December 2018. economy. have been significant 5 to 10 years ago, such as the BRICS for nearly 50 per cent of the measured global advertising countries and the Middle East and North Africa. This shift has seen the emergence of agencies specialising in Islamic marketing, characterised by a strong ethical responsibility to consumers. Future trends indicate the strong emer- gence of consumer brands in areas of the world where sophisticated consumers with brand awareness are currently in the minority (see Table 1). Despite the increase in worldwide advertising revenues, the holding companies that own the world's largest adver- tising groups: WPP, Publicis, Omnicom and Interpublic Group (see Table 2) are under intense pressure in a changing business environment to deliver shareholder value. Intensifying competition In terms of industry sectors, three of the top 10 global advertisers are car manufacturers. However, the two major fmcg (fast-moving consumer goods) producers Procter & Gamble and Nestl are in the three top spots for global advertising spend. Healthcare and beauty (L'Oral), consumer electronics (Samsung), fast food, beverage and confectionery manufacturers are all featured in the top 20 global advertisers. The top 100 advertisers account Advertising agencies come in all sizes and include every- thing from one or two-person 'boutique' operations (which rely mostly on freelance outsourced talent to perform most functions), small- to medium-sized agen- cies, large independents to multinational, multi-agency conglomerates employing over 200,000 people. The Table 2 Top five multi-agency conglomerates: 2017, by revenue, profit before interest and tax, number of employees and agency brands Group name Revenue Employees Advertising agency brands PBIT 2.16bn 1. WPP (UK) 15.2bn 200,000 GroupM, JWT, Grey, Ogilvy, Y&R 2. Omnicom (US) $15.4bn $2.059bn 76,000 BBDO, DDB, TBWA 10.8bn 1.51bn 79,000 Leo Burnett, Saatchi & Saatchi, Publicis, BBH 3. Publicis Groupe (France) 4.IPG (US) $7.88bn $973m 49,700 McCann Erickson, FCB, MullenLowe Group 5. Dentsu (Japan) $7.2bn $938m 47,324 Aegis, Carat, Denstu Media, iProspect, Isobar Sources: WPP, Omnicom, Publicis Groupe, IPG, Dentsu industry has gone through a period of increasing concen- tration through acquisitions, thereby creating multi- agency conglomerates such as those listed in Table 2. While these conglomerates are headquartered in London. New York, Paris and Tokyo, they operate globally. differentiate themselves by offering a mix of web design/ development, search engine marketing, internet advert- ising/marketing, or e-business/e-commerce consulting. They are classified as "agencies because they create digital media campaigns and implement media purchases of ads on behalf of clients on social networking and community sites such as YouTube, Facebook, Instagram, Flickr and other digital media. Large multi-agency conglomerates compete on the basis of the quality of their creative output (as indicated by industry awards), the ability to buy media more cost- effectively, market knowledge, global reach and increas- ingly range of digital services. Some agency groups have integrated vertically into higher-margin marketing services. Omnicom, through its Diversified Agency Services, has acquired printing services and telemar- keting/customer care companies. Other agency groups have vertically integrated to lesser or greater degrees. The rise of mobile and the digital duopoly Mid-sized and smaller boutique advertising agen- cies compete by delivering value-added services through in-depth knowledge of specific market sectors, special ised services such as digital and by building a reputation for innovative and ground-breaking creative advertising/ marketing campaigns. However, they might be more reliant on outsourced creative suppliers than larger agencies. Search companies, such as Google, Bing and Yahoo and social network Facebook, exploit their ability to interact with and gain information about millions of potential consumers of branded products. Facebook and Google have effectively become a 'digital duopoly to the extent that they represent almost 60 per cent of the global digital mobile ad market, according to eMarketer, the research group. Many small specialist agencies are founded by former employees of large agencies. In turn, smaller specialist agencies are often acquired by the large multi-agency conglomerates in order to acquire specific capabilities to target new sectors or markets or provide additional services to existing clients. Digital search and mobile advertising budgets are increasing faster than other traditional advertising media as search companies like Google and Facebook generate revenues from paid search as advertisers discover that targeted ads on mobile and desktop are highly effective (see Table 3). By 2017, Google had a 66 per cent market share of the $81.6bn spent on online search advertising globally, with Facebook also increasing its share. With the development of the Internet and online search advertising, a new breed of interactive digital media agencies established themselves. These agencies Sir Martin Sorrell, the former CEO of WPP the world's largest multi-service agency group, pointed out that Google is a rival for the service relationships with WPP's clients. WPP group spent more than $6bn of its clients' Table 3 Global advertising expenditure by medium (US$ million, at 2016 average rates) 2013 2014 2015 2016 2017 Newspapers 93,019 92,300 91,908 90,070 88,268 Magazines 42,644 42,372 42,300 40,185 39,391 Television 191,198 202,380 213,878 210,670 210,459 Radio 32,580 33,815 35,054 34,457 34,130 Cinema 2,393 2,538 2,681 2,767 2,850 Outdoor 30,945 32,821 34,554 36,143 36,324 Internet-Mobile and 70,518 80,672 91,516 130,019 156,543 Desktop Total 463,387 486,908 511,891 544,401 567,965 Note: The totals in Table 3 are lower than in Table 1, since that table includes advertising expenditure for a few countries where it is not itemised by advertising medium. Sources: ZenithMedia, e-Marketer, Statista, February 2018. Table 4 US mobile ad spending 2015-2019 2019 2018 (estimate) (estimate) Mobile ad spending (US$bn) 28.72 40.50 49.81 57.78 65.87 % change 50.00% 41.00% 23.00% 16.00% 14.00% % of digital ad spending 49.00% 60.40% 66.60% 67.70% 72.20% % of to of total media ad spending 15.30% 20.40% 23.90% 26.30% 28.60% Source: eMarketer.com ad budgets with Google in 2017 and $2.1bn with Face book. Sorrell called Google a 'frenemy' - the combin- ation of "friend' and 'enemy'. Google is a "friend' where it allows WPP to place targeted advertising based on Google analytics and an 'enemy' where it does not share these analytics with the agency and becomes a potential competitor for the customer insight and advertising trad- itionally created by WPP. analytics and artificial intelligence are seen to be becoming more important than creativity which trad- itional advertising agencies have relied upon as a differ- entiator. This is enabling them to offer a range of services to the major marketing companies that compete directly with traditional advertising agencies. The disruptive change in the advertising industry at the beginning of the twenty-first century started with the Internet. The convergence of Internet, TV, smartphones, tablets and laptop computers has had a major impact on the advertising industry. Mobile ad spending on sites such as YouTube, Pinterest and Twitter continues to increase at the expense of desktop, taking a bigger share of marketers budgets. The shift to mobile ad spending is being driven mainly by consumer demand and is predicted to be over 28 per cent of total media ad spending in the US which is why Google has made acquisitions in this sector (see Table 4). Factors that have driven competitive advantage to date may not be relevant in the future. Traditionally the advert- ising industry has embodied the idea of creativity as the vital differentiator between the best and the mediocre- and individuals have often been at the heart of this creativity. The emergence of data analytics, programmatic advertising and the use of artificial intelligence algorithms are disruptive to business as usual' in the industry. A key question is whether creativity will be important in the future, in relation to breadth of services, global reach and data analysis. Entry of 'big data' technology consultancies Sources: ZenithMedia Advertising Age, Statista eMarketer, February 2018. The analysis of "big data' is playing an increasingly important role in helping to create targeted and person- alised advertising campaigns for the world's major marketers. Consultancies, such as Accenture Interactive and IBMIX, as well as the large accountancy firms PwC Digital Services and Deloitte Digital, all with global reach, are now competing for a share of the advertising market by acquiring creative agencies to add to their "big data" digital services and have now entered the top 10 agencies ranked on the basis of turnover. Questions 1 Carry out a five forces analysis of the advertising industry. What are the strengths of the five forces and what underlying factors drive them? What is the industry attractiveness? Their services include programmatic advertising and the use of artificial intelligence algorithms that analyse consumer behaviour allowing for real-time campaign 2 What strategic group dimensions and strategic optimisations towards an audience more likely to convert to the advertiser's product or service, which is groups can you identify? What are the differences between them? a major innovation, the impact of which is still being 3 Which PESTEL factors are driving changes in the assessed. This has led some industry experts to observe that 'Madmen' now need to become 'Mathsmen", as data industry? Which factors are becoming more negative or positive for the major advertising agencies? 2015 2016 2017 3. Analysis of porter's five forces. 4. Analysis of the strategic groups of a global advertising agency. 5. Analysis of external factors analysis of global advertising agency. IF 6. Recommendation for the global advertising industry (Give at least three recommendations for the future)