

Question: Case: Quality Management - Toyota - Quality Control Analytics As part of the process for improving the quality of their cars, Toyota engineers have identified
Case: Quality Management Toyota Quality Control Analytics
As part of the process for improving the quality of their cars, Toyota engineers have identified a potential improvement to the process
that makes a washer that is used in the accelerator assembly. The tolerances on the thickness of the washer are fairly large since the
fit can be loose, but if it does happen to get too large, it can cause the accelerator to bind and create a potential problem for the
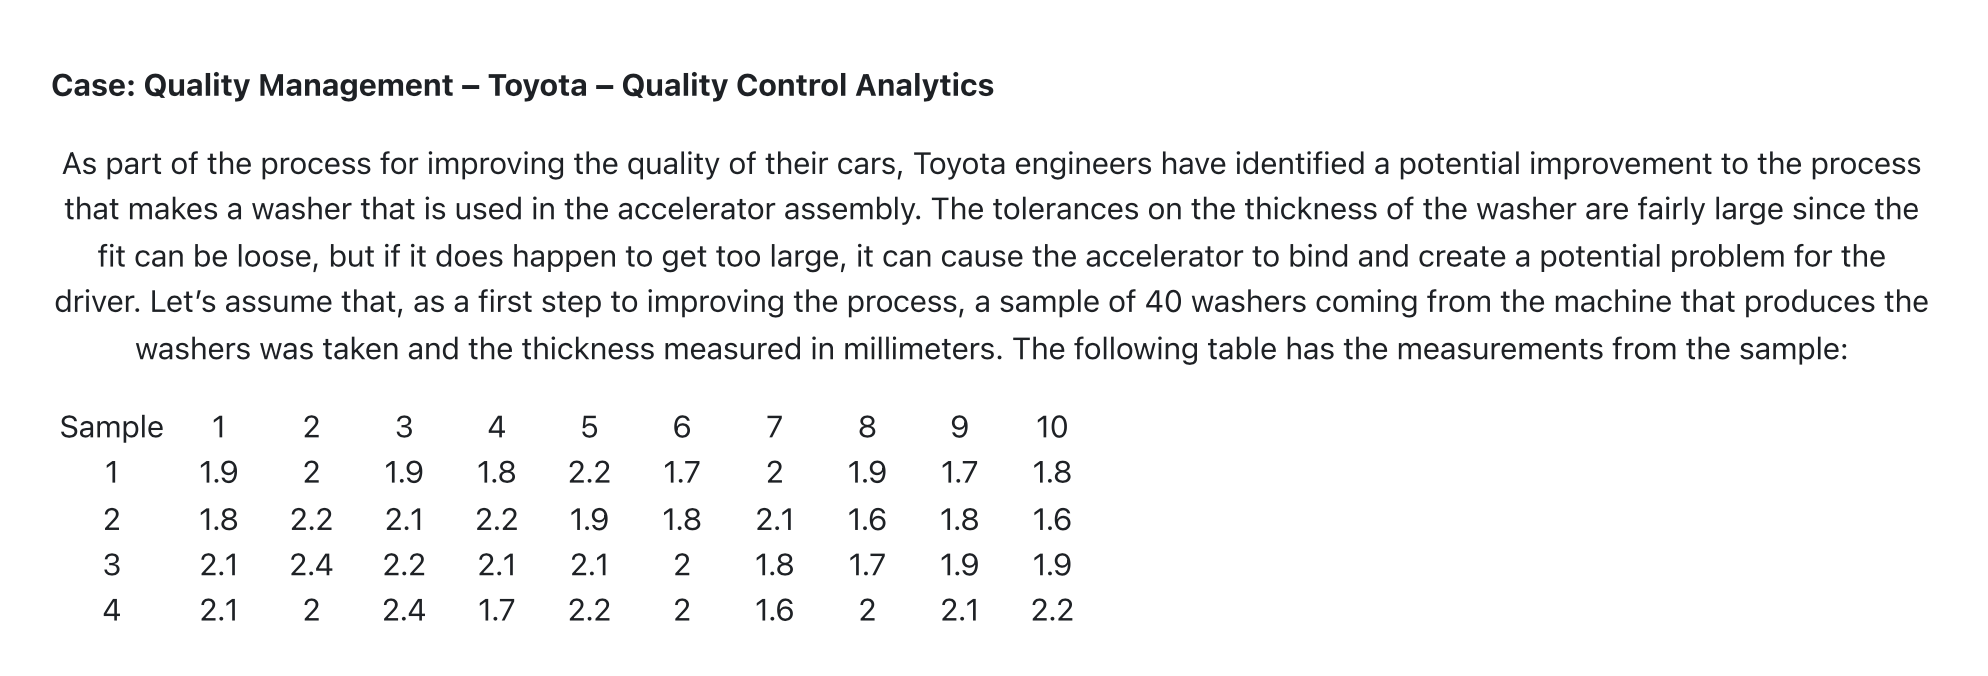
driver. Let's assume that, as a first step to improving the process, a sample of washers coming from the machine that produces the
washers was taken and the thickness measured in millimeters. The following table has the measurements from the sample:
Sample
If the specification is such that no washer should be greater than millimeters, assuming that the thicknesses are distributed normally, what fraction of the output is expected to be greater than this thickness? Round your answer to decimals.
What if there is an upper and lower specification, where the upper thickness limit is and the lower thickness limit is What fraction of the output is expected to be out of tolerance? Round your answer to six decimals.
What is the Cpk for the process? Round your answer to decimals.
What would be the Cpfor the process if it were centered assume the process standard deviation is the same Round your answer to decimals.
Whatpercentageof output would be expected to be out of tolerance if the process were centered? Round your answer to decimals.
Setup Xbar and Range control charts for the current process. Assume the operators will take samples of washers at a time.
What is The upper control limit for the Xbar chart? Round your answer to decimals.
Plot the data on your control charts. Does the current process appear to be in control?
a No the process is clearly out of control, with multiple data points beyond control limits
b Yes, the process appears to be in control with no trends or concerns.
c No the process shows signs of instability, with significant variability but no observable trends.
d Yes, the process appears to be in control, but its challenging to conclude definitively due to the limited number of samples. Additionally, a trend in both process mean and variability may be emerging.
If the process could be improved so that the standard deviation was only about millimeters, what would be the best that could be expected with the processes relative to fraction defective? What is the value of DPMO? Round your answer to decimals.
Step by Step Solution
There are 3 Steps involved in it
1 Expert Approved Answer
Step: 1 Unlock

Question Has Been Solved by an Expert!
Get step-by-step solutions from verified subject matter experts
Step: 2 Unlock
Step: 3 Unlock