

Question: Case Study 3: Action Improving Mortality from Sepsis One academic health system charged its health IT and quality improvement experts with analyzing the system's mortality
![He, the percentage of patients with sepsis who died] as the key](https://s3.amazonaws.com/si.experts.images/answers/2024/07/66896d5c5dec3_46066896d5c04ef2.jpg)
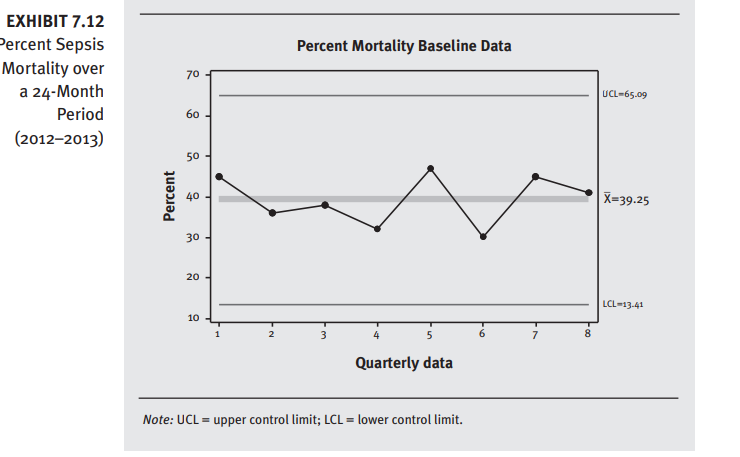
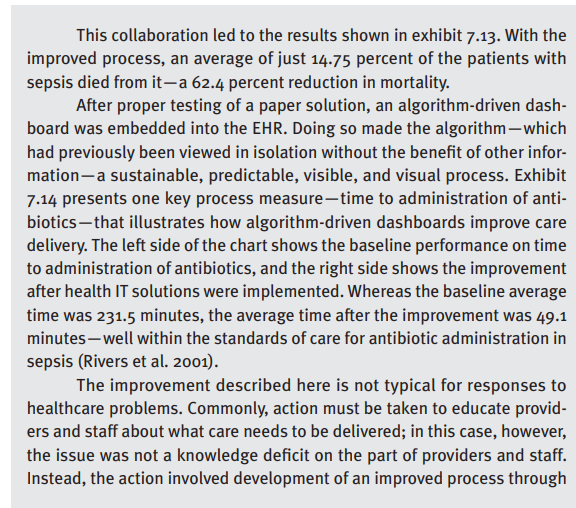
Case Study 3: Action Improving Mortality from Sepsis One academic health system charged its health IT and quality improvement experts with analyzing the system's mortality outcomes from sepsis. The group chose percent mortality in sepsis He, the percentage of patients with sepsis who died] as the key metric to evaluate. Exhibit 7.12 shows the baseline data for the institution's percent mortality in sepsis. showing that, on average, 39.25 percent of patients with sepsis died from it. The partnership with health IT provided the baseline data needed to develop an action plan to improve outcomes. Along with the outcome metric shown in exhibit 7.12, multiple process measures were obtained, revealing clear gaps in performance and opportunities for improvement. Through detailed process mappingincorporating both direct observations of the process and brainstorming sessions with the care delivery team to discuss barriers to timely interventions and assessmentsthe team developed a practical, visual algorithm that was ready to be \"test-driven" on paper. The improvement was developed to blend into the workflow at the bedside and turn an often complex and chaotic process into a streamlined and predict- able one. Still missing, though, was the anywhereianytime access afforded by having this process embedded in the EH R. EXHIBIT 7.12 Percent Sepsis Percent Mortality Baseline Data Mortality over 70 a 24-Month UCL-65.09 Period 60 (2012-2013) Percent 40 X=39.25 30 20 - LCL-13-41 10 7 Quarterly data Note: UCL = upper control limit; LCL = lower control limit.This collaboration led to the results shown in exhibit 7.13. With the improved process, an average ofjust 14.75 percent of the patients with sepsis died from ita 62.4 percent reduction in mortality. After proper testing of a paper solution, an algorithm-driven dash- board was embedded into the EHR. Doing so made the algorithmwhich had previously been viewed in isolation without the benet of other infor- mationa sustainable, predictable, visible, and visual process. Exhibit 7.14 presents one key process measuretime to administration of anti- bioticsthat illustrates how algorithm-driven dashboards improve care delivery. The left side ofthe chart shows the baseline performance on time to administration of antibiotics, and the right side shows the improvement after health IT solutions were implemented. Whereas the baseline average time was 231.5 minutes, the average time after the improvement was 49.1 minuteswell within the standards of care for antibiotic administration in sepsis (Rivers et al. 2001]. The improvement described here is not typical for responses to healthcare problems. Commonly, action must be taken to educate provid- ers and staff about what care needs to be delivered: in this case, however, the issue was not a knowledge decit on the part of providers and staff. Instead, the action involved development of an improved process through EXHIBIT 7.13 Percent Mortality Before and After Improvement Percent Sepsis Baseline Improvement Mortality, 70 - Before and After 60 - Improvement Implementation 50- (2012-2015) 40- Percent 30- UCL - 21.97 20- X=14.75 10 - LCL-7-53 W 9 11 13 15 Quarterly data Note: Data here are for the same 24-month period shown in exhibit 7.12, followed by an ad- ditional 24-month postimplementation improvement period in 2014-2015. UCL = upper control limit; LCL = lower control limit. (continued)EXHIBIT 7.14 Time to Administration of Antibiotics [same 24-month period as exhibit 7.12, in 2012-2014; improvement is the 24-month period of 20142o15) Time to hntibiotic Administration Before and lter Improvement Baseli ne Improvement 3oo ZCHJ 150 Time in minutes 1.00 350 l | 50 D I I 1 3 5 I" 9 11 13 15 Quarterly data Note: Data here are for the same eel-month period shown in exhibit 7.12. followed by an ad- ditionalzq-month postimplementalion improvement period in eon2015. UCL- upper control limit; LCL - lower control limit. creation of an algorithm designed around the bedside workflow. followed by implementation of a visible and visual display of the information. This approach highlights how health IT and quality improvement can partner to make the work of the entire care delivery.' team better coordinated. Case Study Discussion Questions 1. Describe the relationship between the institution's percent mortality in sepsis and the change in time to administration of antibiotics. Why was a health IT solution superior to a more manual process in this case? 2. In this case, health IT made direct observations of the care provided to patients with sepsis. In what ways could these observations have provided additional information that would not have been detected in data abstracted from the EH R
Step by Step Solution
There are 3 Steps involved in it

Get step-by-step solutions from verified subject matter experts