Question: Case Study - 4 Questions 1. Develop forecasts using regressions of sales on each of the series of rain forecasts, respectively. Calculate the MFE (bias),
Case Study - 4 Questions
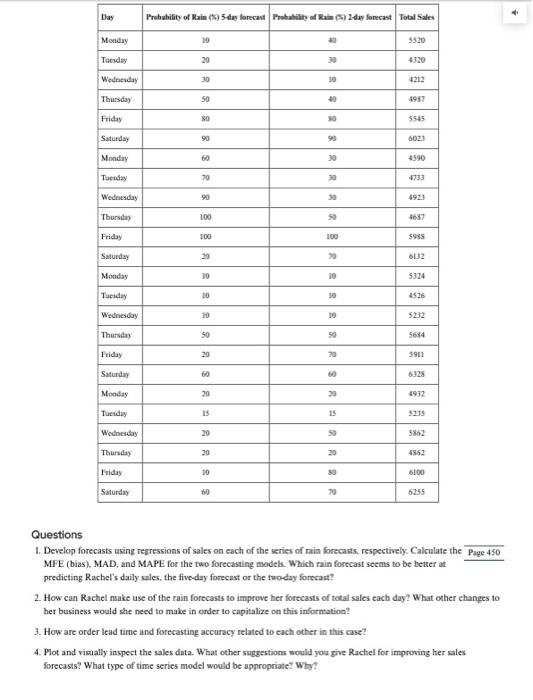
1. Develop forecasts using regressions of sales on each of the series of rain forecasts, respectively. Calculate the MFE (bias), MAD, and MAPE for the two forecasting models. Which rain forecast seems to be better at predicting Rachels daily sales, the five-day forecast or the two-day forecast?
2. How can Rachel make use of the rain forecasts to improve her forecasts of total sales each day? What other changes to her business would she need to make in order to capitalize on this information?
3. How are order lead time and forecasting accuracy related to each other in this case?
4. Plot and visually inspect the sales data. What other suggestions would you give to Rachel for improving her sales forecasts? What type o
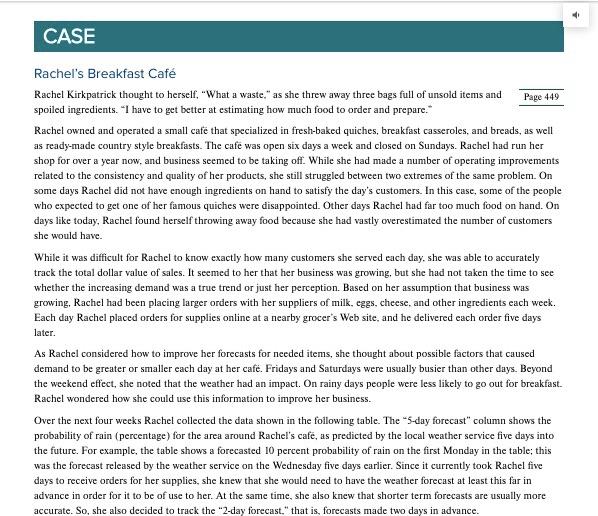
CASE Page 449 Rachel's Breakfast Caf Rachel Kirkpatrick thought to herself, "What a waste," as she threw away three bags full of unsold items and spoiled ingredients. I have to get better at estimating how much food to order and prepare." Rachel owned and operated a small cafe that specialized in fresh-baked quiches, breakfast casseroles, and breads, as well as ready-made country style breakfasts. The cafe was open six days a week and closed on Sundays. Rachel had run her shop for over a year now, and business seemed to be taking off. While she had made a number of operating improvements related to the consistency and quality of her products, she still struggled between two extremes of the same problem. On some days Rachel did not have enough ingredients on hand to satisfy the day's customers. In this case, some of the people who expected to get one of her famous quiches were disappointed. Other days Rachel had far too much food on hand. On days like today, Rachel found herself throwing away food because she had vastly overestimated the number of customers she would have While it was difficult for Rachel to know exactly how many customers she served each day, she was able to accurately track the total dollar value of sales. It seemed to her that her business was growing, but she had not taken the time to see whether the increasing demand was a true trend or just her perception. Based on her assumption that business was growing, Rachel had been placing larger orders with her suppliers of milk, eggs, cheese and other ingredients each week. Each day Rachel placed orders for supplies online at a nearby grocer's Web site, and he delivered each order five days later. As Rachel considered how to improve her forecasts for needed items, she thought about possible factors that caused demand to be greater or smaller cach day at her cafe. Fridays and Saturdays were usually busier than other days. Beyond the weekend effect, she noted that the weather had an impact. On rainy days people were less likely to go out for breakfast. Rachel wondered how she could use this information to improve her business. Over the next four weeks Rachel collected the data shown in the following table. The "5-day forecast" column shows the probability of rain (percentage) for the area around Rachel's cafe, as predicted by the local weather service five days into the future. For example, the table shows a forecasted 10 percent probability of rain on the first Monday in the table; this was the forecast released by the weather service on the Wednesday five days earlier. Since it currently took Rachel five days to receive orders for her supplies, she knew that she would need to have the weather forecast at least this far in advance in order for it to be of use to her. At the same time, she also knew that shorter term forecasts are usually more accurate. So, she also decided to track the "2-day forecast," that is, forecasts made two days in advance. Das Probability of Rain (195day forecast Probability of Rains ) 2day forecast Total Sales Monday 19 5520 Tuesday 20 4320 Wednesday 30 30 4212 Thursday SO 40 4987 Friday NO 5545 Saturday 90 90 602.3 Monday 60 30 4590 Tuesday 70 30 4733 Wednesday 90 Thursday 100 so 4637 Friday 100 100 5985 Saturday 20 70 6132 Monday 10 10 5324 Tuesday 10 30 4526 Wednesday 10 30 5232 50 50 5684 Thursday Friday 20 20 5911 Saturday 60 so 6328 Monday 20 29 4932 Tuesday 13 32.15 Wednesday 20 so 5862 Thursday 20 Friday 10 50 6100 Saturday 70 6255 Questions 1. Develop forecasts using regressions of sales on cach of the series of rain forecasts, respectively. Calculate the Page 450 MFE (bias). MAD, and MAPE for the two forecasting models. Which rain forecast seems to be better at predicting Rachel's daily sales, the five-day forecast or the two-day forecast? 2. How can Rachel make use of the rain forecasts to improve her forecasts of total sales each day? What other changes to her business would she need to make in order to capitalize on this information 3. How are order lead time and forecasting accuracy related to each other in this case? 4. Plot and visually inspect the sales data. What other suggestions would you give Rachel for improving her sales forecasts? What type of time series model would be appropriate? Why