

Question: Case Study ABC Inc. is a Corporation with a focus on Garment and textile manufacturing in the UAE. They are now looking to finance their
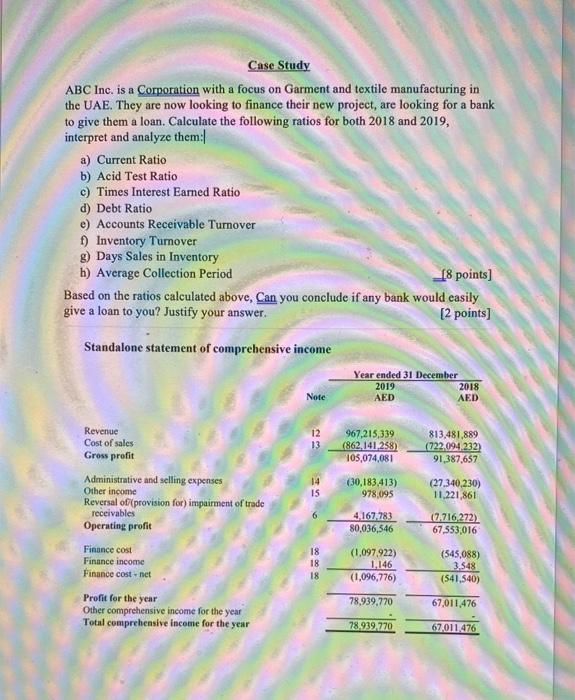
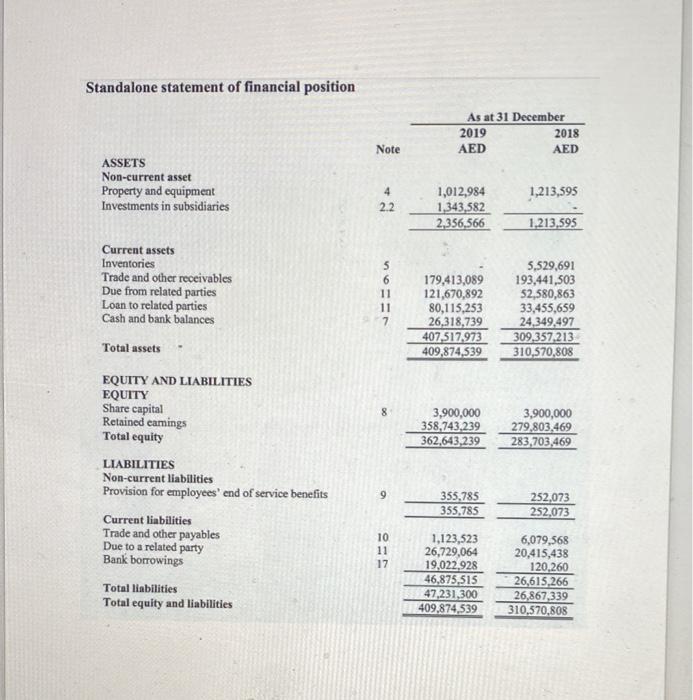
Case Study ABC Inc. is a Corporation with a focus on Garment and textile manufacturing in the UAE. They are now looking to finance their new project, are looking for a bank to give them a loan. Calculate the following ratios for both 2018 and 2019, interpret and analyze them: a) Current Ratio b) Acid Test Ratio c) Times Interest Earned Ratio d) Debt Ratio e) Accounts Receivable Turnover f) Inventory Tumover g) Days Sales in Inventory h) Average Collection Period _18 points) Based on the ratios calculated above, Can you conclude if any bank would easily give a loan to you? Justify your answer. [2 points) Standalone statement of comprehensive income Year ended 31 December 2019 2018 AED AED Note 12 13 967,215,339 (862.141.258) 105,074,081 813.481,889 (722.094,232) 91,387,657 Revenue Cost of sales Gross profit Administrative and selling expenses Other income Reversal of(provision for) impairment of trade receivables Operating profit 14 15 (30,183,413) 978,095 (27.340,230) 11.221,861 4167,283 80,036,546 124716,272) 67,553,016 18 18 18 (1,097,922) 1.146 (1,096,776) (545,088) 3.548 (541,540) Finance cost Finance income Finance cost-net Profit for the year Other comprehensive income for the year Total comprehensive income for the year 78,939,770 67,011,476 78.939,270 67011476 Standalone statement of financial position As at 31 December 2019 2018 AED AED Note ASSETS Non-current asset Property and equipment Investments in subsidiaries 4 2.2 1,213,595 1,012,984 1.343,582 2,356,566 1.213,595 Current assets Inventories Trade and other receivables Due from related parties Loan to related parties Cash and bank balances 5 6 11 11 7 179,413,089 121,670,892 80,115,253 26,318,739 407,517,973 409,874,539 5,529,691 193,441,503 52,580,863 33,455,659 24,349,497 309,357,213 310,570,808 Total assets 8 3,900,000 358,743,239 362,643,239 3,900,000 279,803,469 283,703,469 EQUITY AND LIABILITIES EQUITY Share capital Retained camings Total equity LIABILITIES Non-current liabilities Provision for employees' end of service benefits Current liabilities Trade and other payables Due to a related party Bank borrowings Total liabilities Total equity and liabilities 9 355.785 355.785 252,073 252,073 10 11 17 1,123,523 26,729,064 19,022,928 46,875,515 47,231,300 409,874,539 6,079,568 20,415,438 120,260 26,615,266 26,867,339 310.570,808
Step by Step Solution
There are 3 Steps involved in it

Get step-by-step solutions from verified subject matter experts