

Question: Cases Valid Missing Total RACE N Percent N Percent N Percent INCIDENCE AFAM 51 100.0% 0.0% 51 100.0% NHW 51 100.0% 0.0% 51 100.0% Descriptives
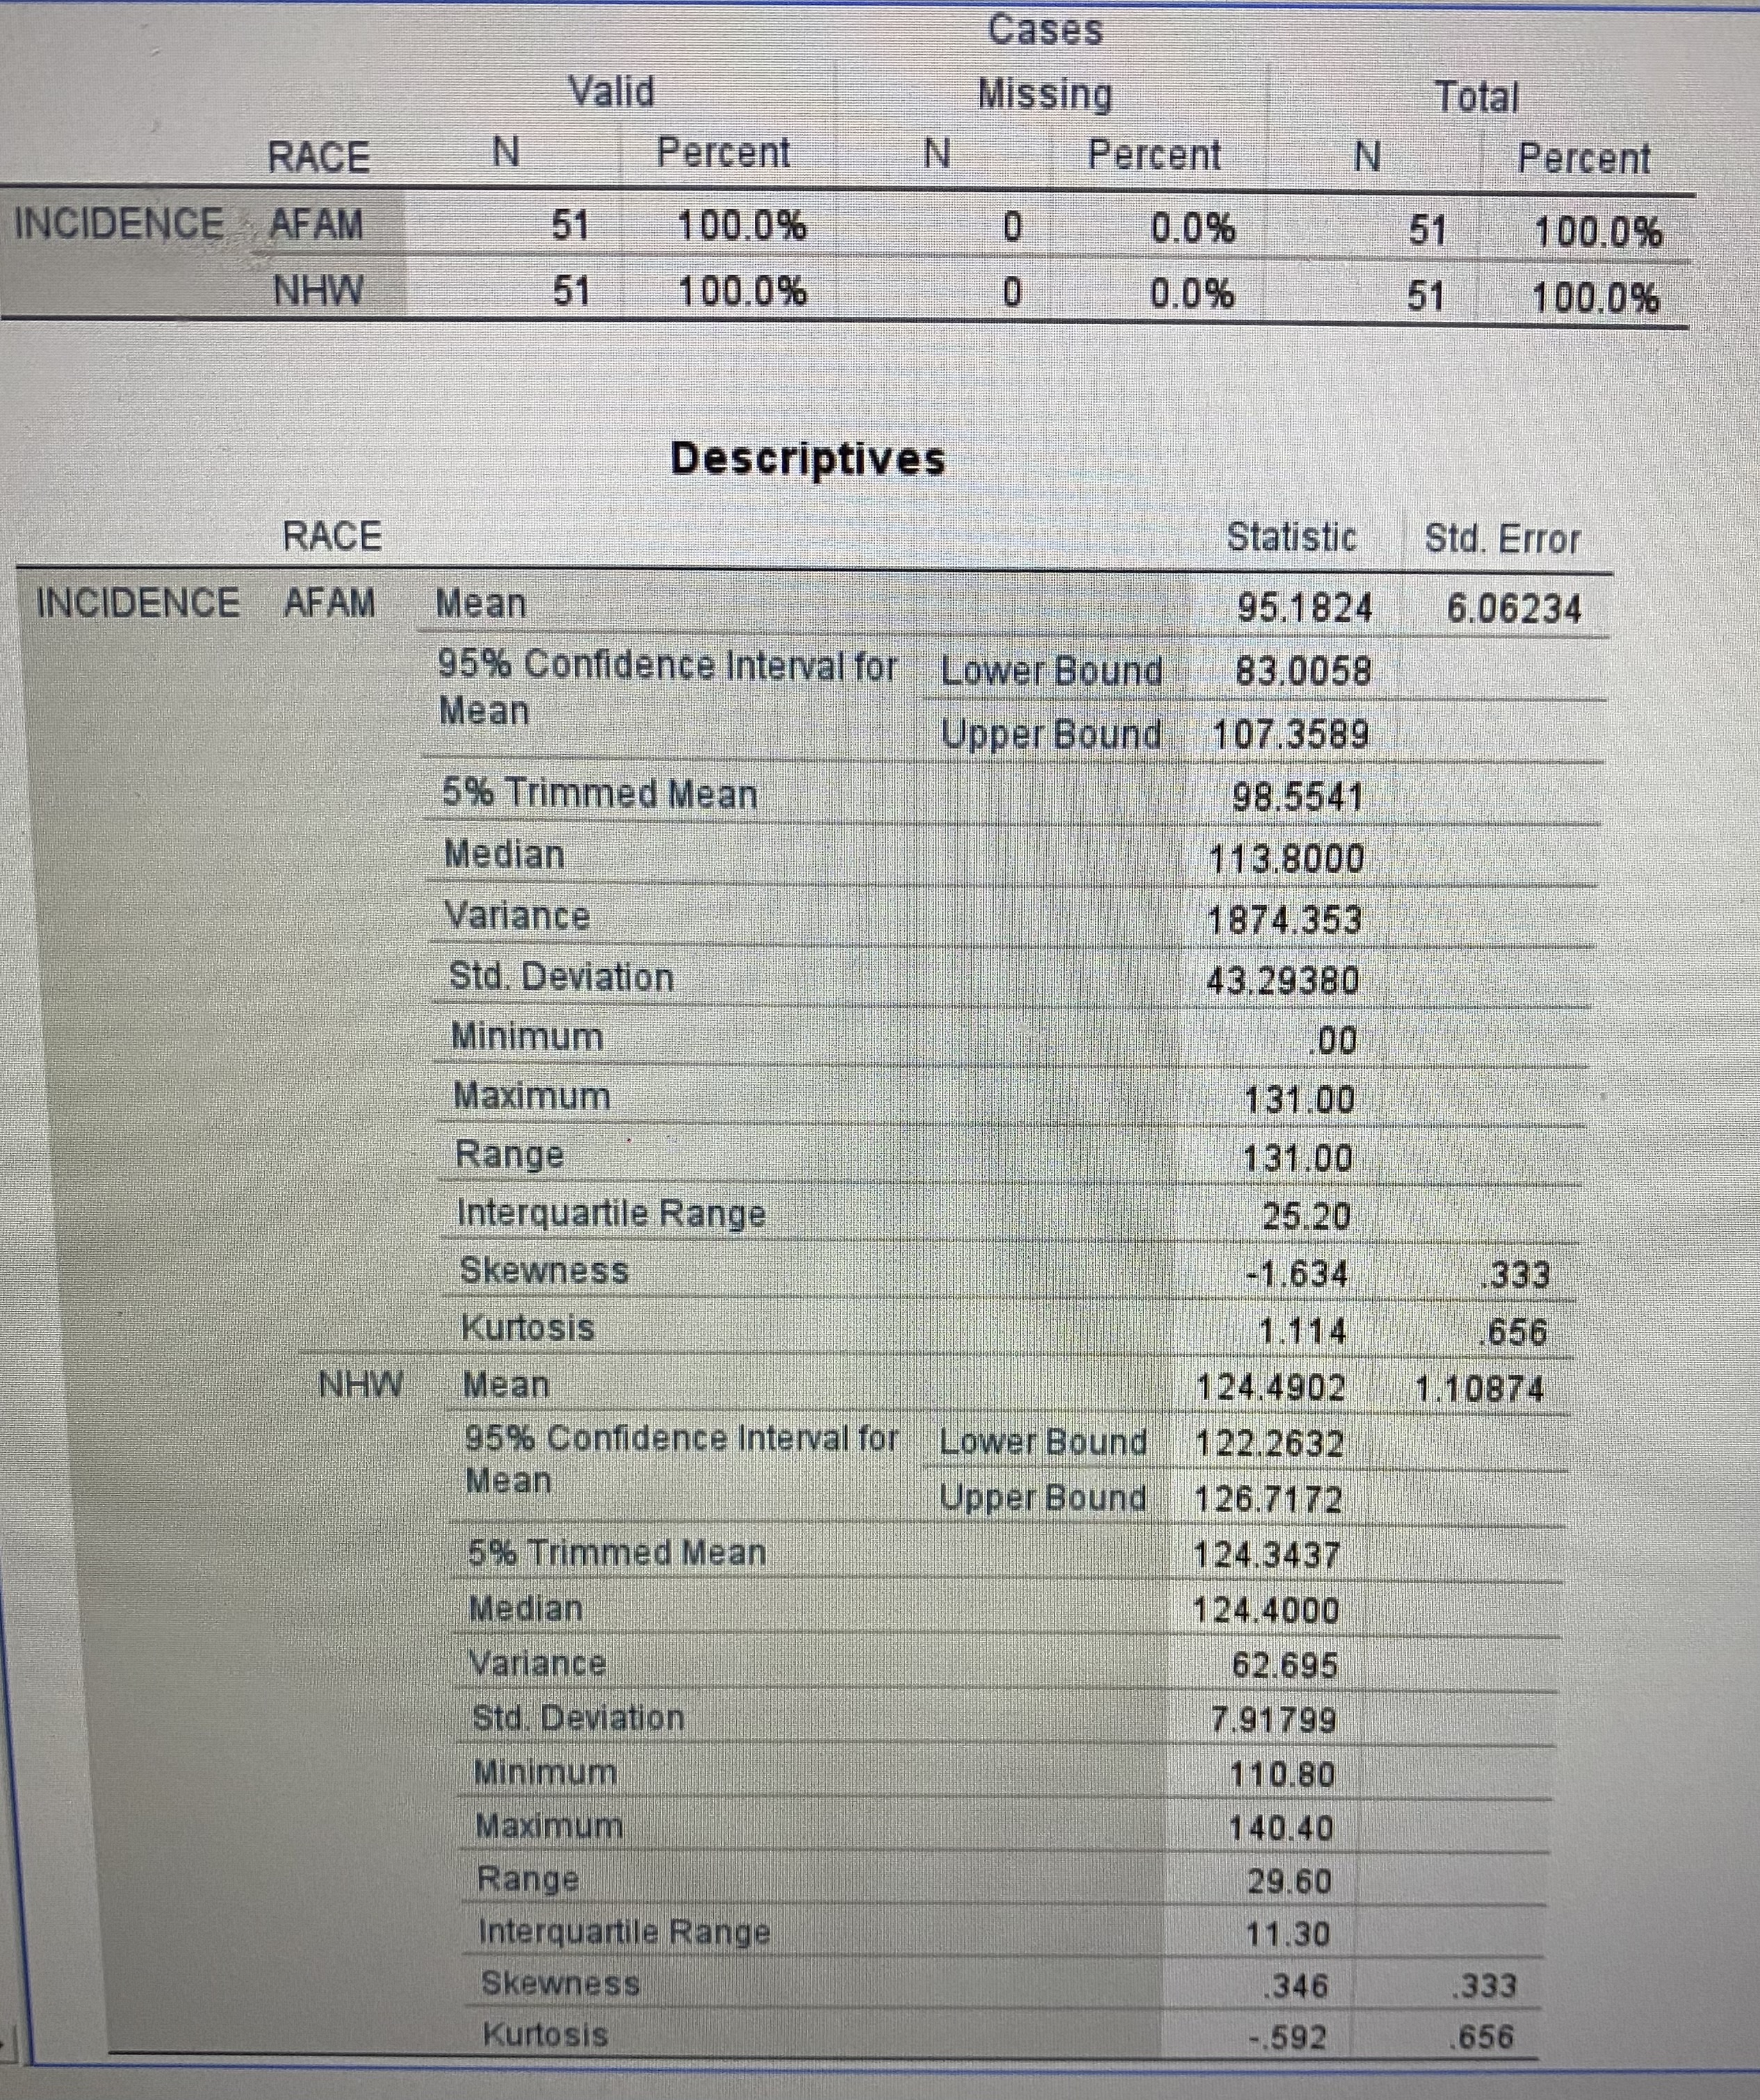
Cases Valid Missing Total RACE N Percent N Percent N Percent INCIDENCE AFAM 51 100.0% 0.0% 51 100.0% NHW 51 100.0% 0.0% 51 100.0% Descriptives RACE Statistic Std. Error INCIDENCE AFAM Mean 95.1824 6.06234 95% Confidence Interval for Lower Bound 83.0058 Mean Upper Bound 107.3589 5% Trimmed Mean 98.5541 Median 113.8000 Variance 1874.353 Std. Deviation 43.29380 Minimum .00 Maximum 131.00 Range 131.00 Interquartile Range 25.20 Skewness -1.634 333 Kurtosis 1.114 656 NHW Mean 124.4902 1.10874 95% Confidence Interval for|Lower Bound 122.2632 Mean Upper Bound 126.7172 5% Trimmed Mean 124.3437 Median 124.4000 Variance 62.695 Std. Deviation 7.91799 Minimum 110.80 Maximum 140.40 Range 29.60 Interquartile Range 11.30 Skewness 346 333 Kurtosis -.592 656
Step by Step Solution
There are 3 Steps involved in it

Get step-by-step solutions from verified subject matter experts