

Question: cel, etc, not by hand! ) with proper formatting ( axis labels, etc ) but be sure to clearly show all analysis by hand. 1
cel, etc, not by hand! with proper formatting axis labels, etc but be sure to clearly show all analysis by hand.
You are using a sensing system that consists of a pressure gauge sensor a low pass filter, and an DAQ board which will be ignored for most of this analysis The sensor has a ndorder response and the filter has a storder response. DAQ boards can be modeled as zeroth order instruments and perfect sensitivity
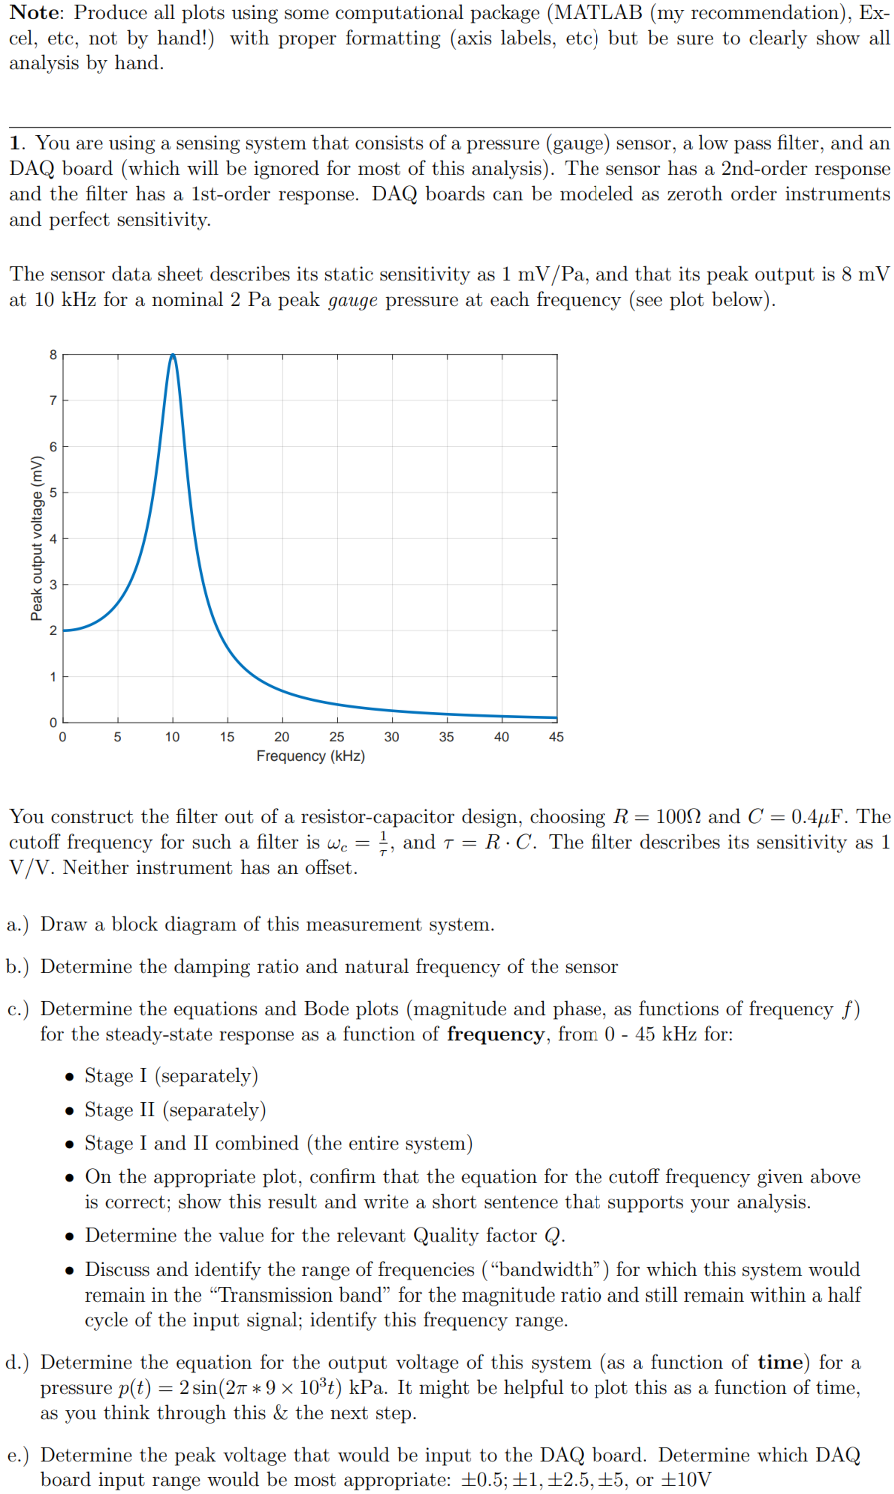
The sensor data sheet describes its static sensitivity as mathrmmVmathrmPa and that its peak output is mV at kHz for a nominal Pa peak gauge pressure at each frequency see plot below
You construct the filter out of a resistorcapacitor design, choosing ROmega and Cmu mathrm~F The cutoff frequency for such a filter is omegacfractau and tauR cdot C The filter describes its sensitivity as VV Neither instrument has an offset.
a Draw a block diagram of this measurement system.
b Determine the damping ratio and natural frequency of the sensor
c Determine the equations and Bode plots magnitude and phase, as functions of frequency f for the steadystate response as a function of frequency, from mathrmkHz for:
Stage I separately
Stage II separately
Stage I and II combined the entire system
On the appropriate plot, confirm that the equation for the cutoff frequency given above is correct; show this result and write a short sentence that supports your analysis.
Determine the value for the relevant Quality factor Q
Discuss and identify the range of frequencies bandwidth for which this system would remain in the "Transmission band" for the magnitude ratio and still remain within a half cycle of the input signal; identify this frequency range.
d Determine the equation for the output voltage of this system as a function of time for a pressure ptsin leftpi times trightmathrmkPa It might be helpful to plot this as a function of time, as you think through this & the next step.
e Determine the peak voltage that would be input to the DAQ board. Determine which DAQ board input range would be most appropriate: pm ; pm pm pm or pm mathrm~V
Step by Step Solution
There are 3 Steps involved in it
1 Expert Approved Answer
Step: 1 Unlock

Question Has Been Solved by an Expert!
Get step-by-step solutions from verified subject matter experts
Step: 2 Unlock
Step: 3 Unlock