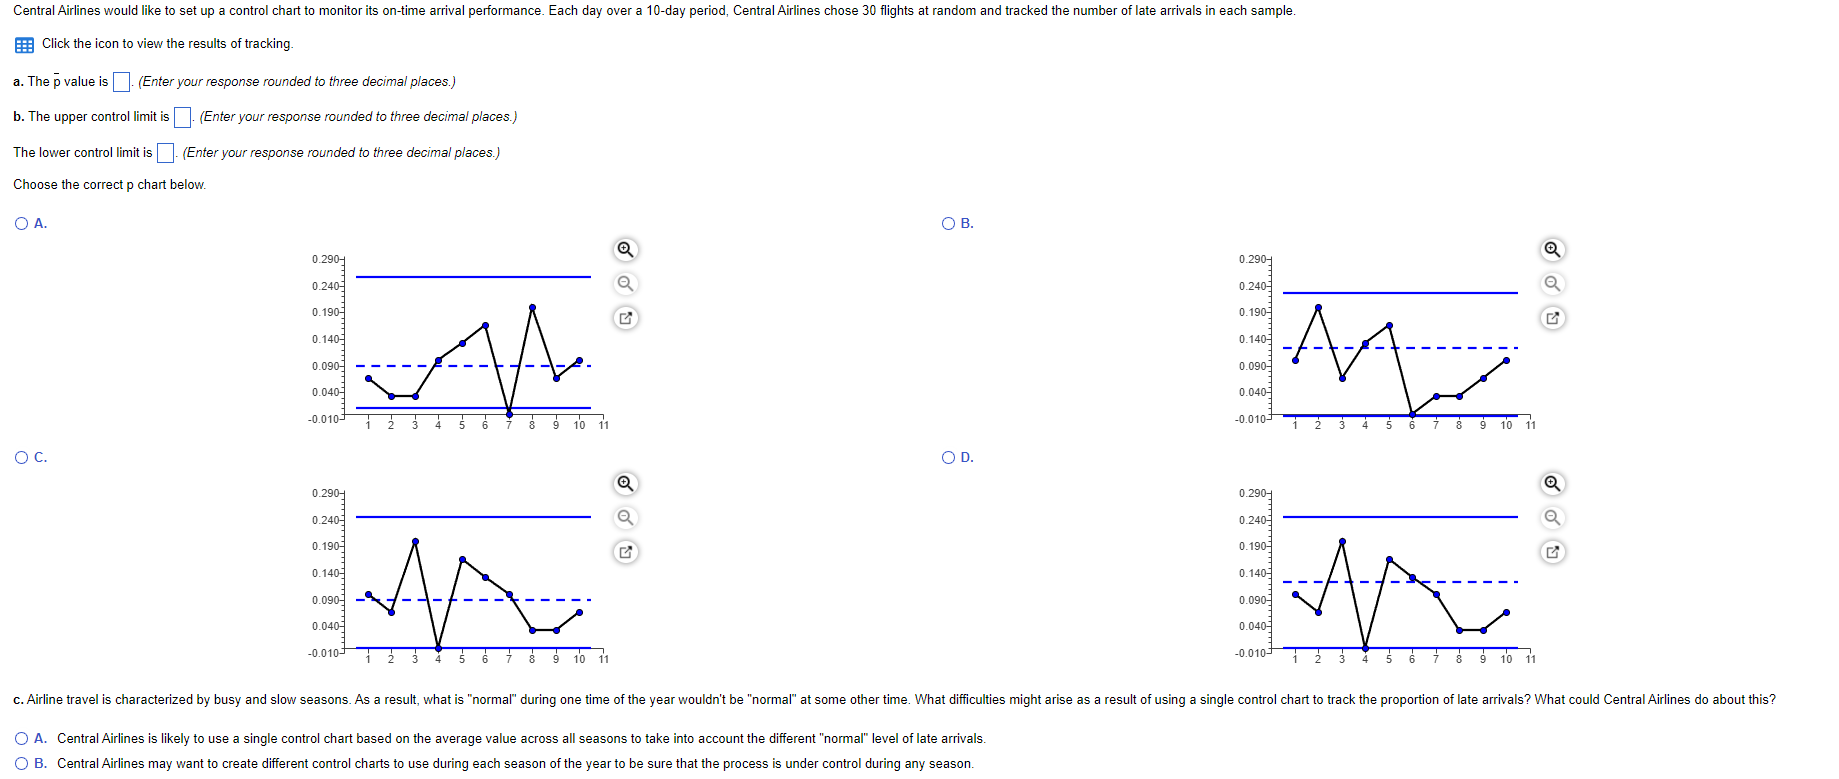
Question: Central Airlines would like to set up a control chart to monitor its on-time arrival performance. Each day over a 10-day period, Central Airlines chose

Central Airlines would like to set up a control

Central Airlines would like to set up a control chart to monitor its on-time arrival performance. Each day over a 10-day period, Central Airlines chose 30 flights at random and tracked the number of late arrivals in each sample. Click the icon to view the results of tracking. a. The p value is (Enter your response rounded to three decimal places.) b. The upper control limit is (Enter your response rounded to three decimal places.) The lower control limit is (Enter your response rounded to three decimal places.) Choose the correct p chart below. OA. OB. 0.290- 0.290- 0.240 Q 0.240 0.190 0.190 0.140 0.140 At AA 0.090 0.090 0.0407 0.0401 -0.010- 8 -0.010- 9 10 11 9 10 10 11 OC. OD 0.290- 0.2904 0.240 0.240 0.190 0.1907 AN 0.140- 0.140 0.090) 0.090 0.040- 0.0407 -0.010 3 4 5 9 10 11 -0.010- 12 6 9 10 11 c. Airline travel is characterized by busy and slow seasons. As a result, what is "normal" during one time of the year wouldn't be "normal" at some other time. What difficulties might arise as a result of using a single control chart to track the proportion of late arrivals? What could Central Airlines do about this? O A. Central Airlines is likely to use a single control chart based on the average value across all seasons to take into account the different "normal" level of late arrivals. B. Central Airlines may want to create different control charts to use during each season of the year to be sure that the process is under control during any season

Step by Step Solution

There are 3 Steps involved in it

1 Expert Approved Answer
Step: 1 Unlock blur-text-image
Question Has Been Solved by an Expert!

Get step-by-step solutions from verified subject matter experts

Step: 2 Unlock
Step: 3 Unlock

Students Have Also Explored These Related General Management Questions!