

Question: Central Airlines would like to set up a control chart to monitor its on-time arrival performance. Each day over a 10-day period, Central Airlines chose
Central Airlines would like to set up a control chart to monitor its on-time arrival performance. Each day over a 10-day period, Central Airlines chose 30 flights at random and tracked the number of late arrivals in each sample.
The results are as follows: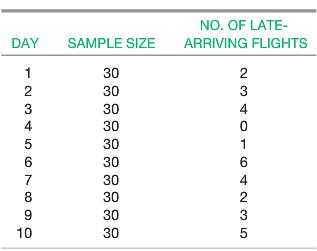 a. Calculate p
b. Set up a p chart to track the proportion of late arrivals.
c. Airline travel is characterized by busy and slow seasons. As a result, what is "normal" during one time of the year wouldn't be "normal" at some other time.
What difficulties might arise as a result of using a single control chart to track the proportion of late arrivals? What could Central Airlines do about this?
NO. OF LATE- DAY SAMPLE SIZE ARRIVING FLIGHTS 1 30 2 2 30 3 3 30 4 4 30 30 1 6 30 6 7 30 4 8 30 2 30 3 10 30
Step by Step Solution
3.36 Rating (165 Votes )
There are 3 Steps involved in it
tr msoheightsourceauto col msowidthsourceauto br msodataplacementsamecell style0 msonumberformatGeneral textaligngeneral verticalalignbottom whitespac... View full answer

Get step-by-step solutions from verified subject matter experts
Document Format (1 attachment)
436-B-M-L-S-C-M (2634).xlsx
300 KBs Excel File