

Question: Ch 3 : Forecasting: Tracking Signals, Mad, Exponential Smoothing, Control Charts Media Consultants ( 1 0 Pts ) . Media Consultants uses proven techniques to
Ch : Forecasting: Tracking Signals, Mad, Exponential Smoothing, Control Charts Media Consultants Pts
Media Consultants uses proven techniques to measure forecast accuracy and to determine when the forecast needs to be reviewedupdated
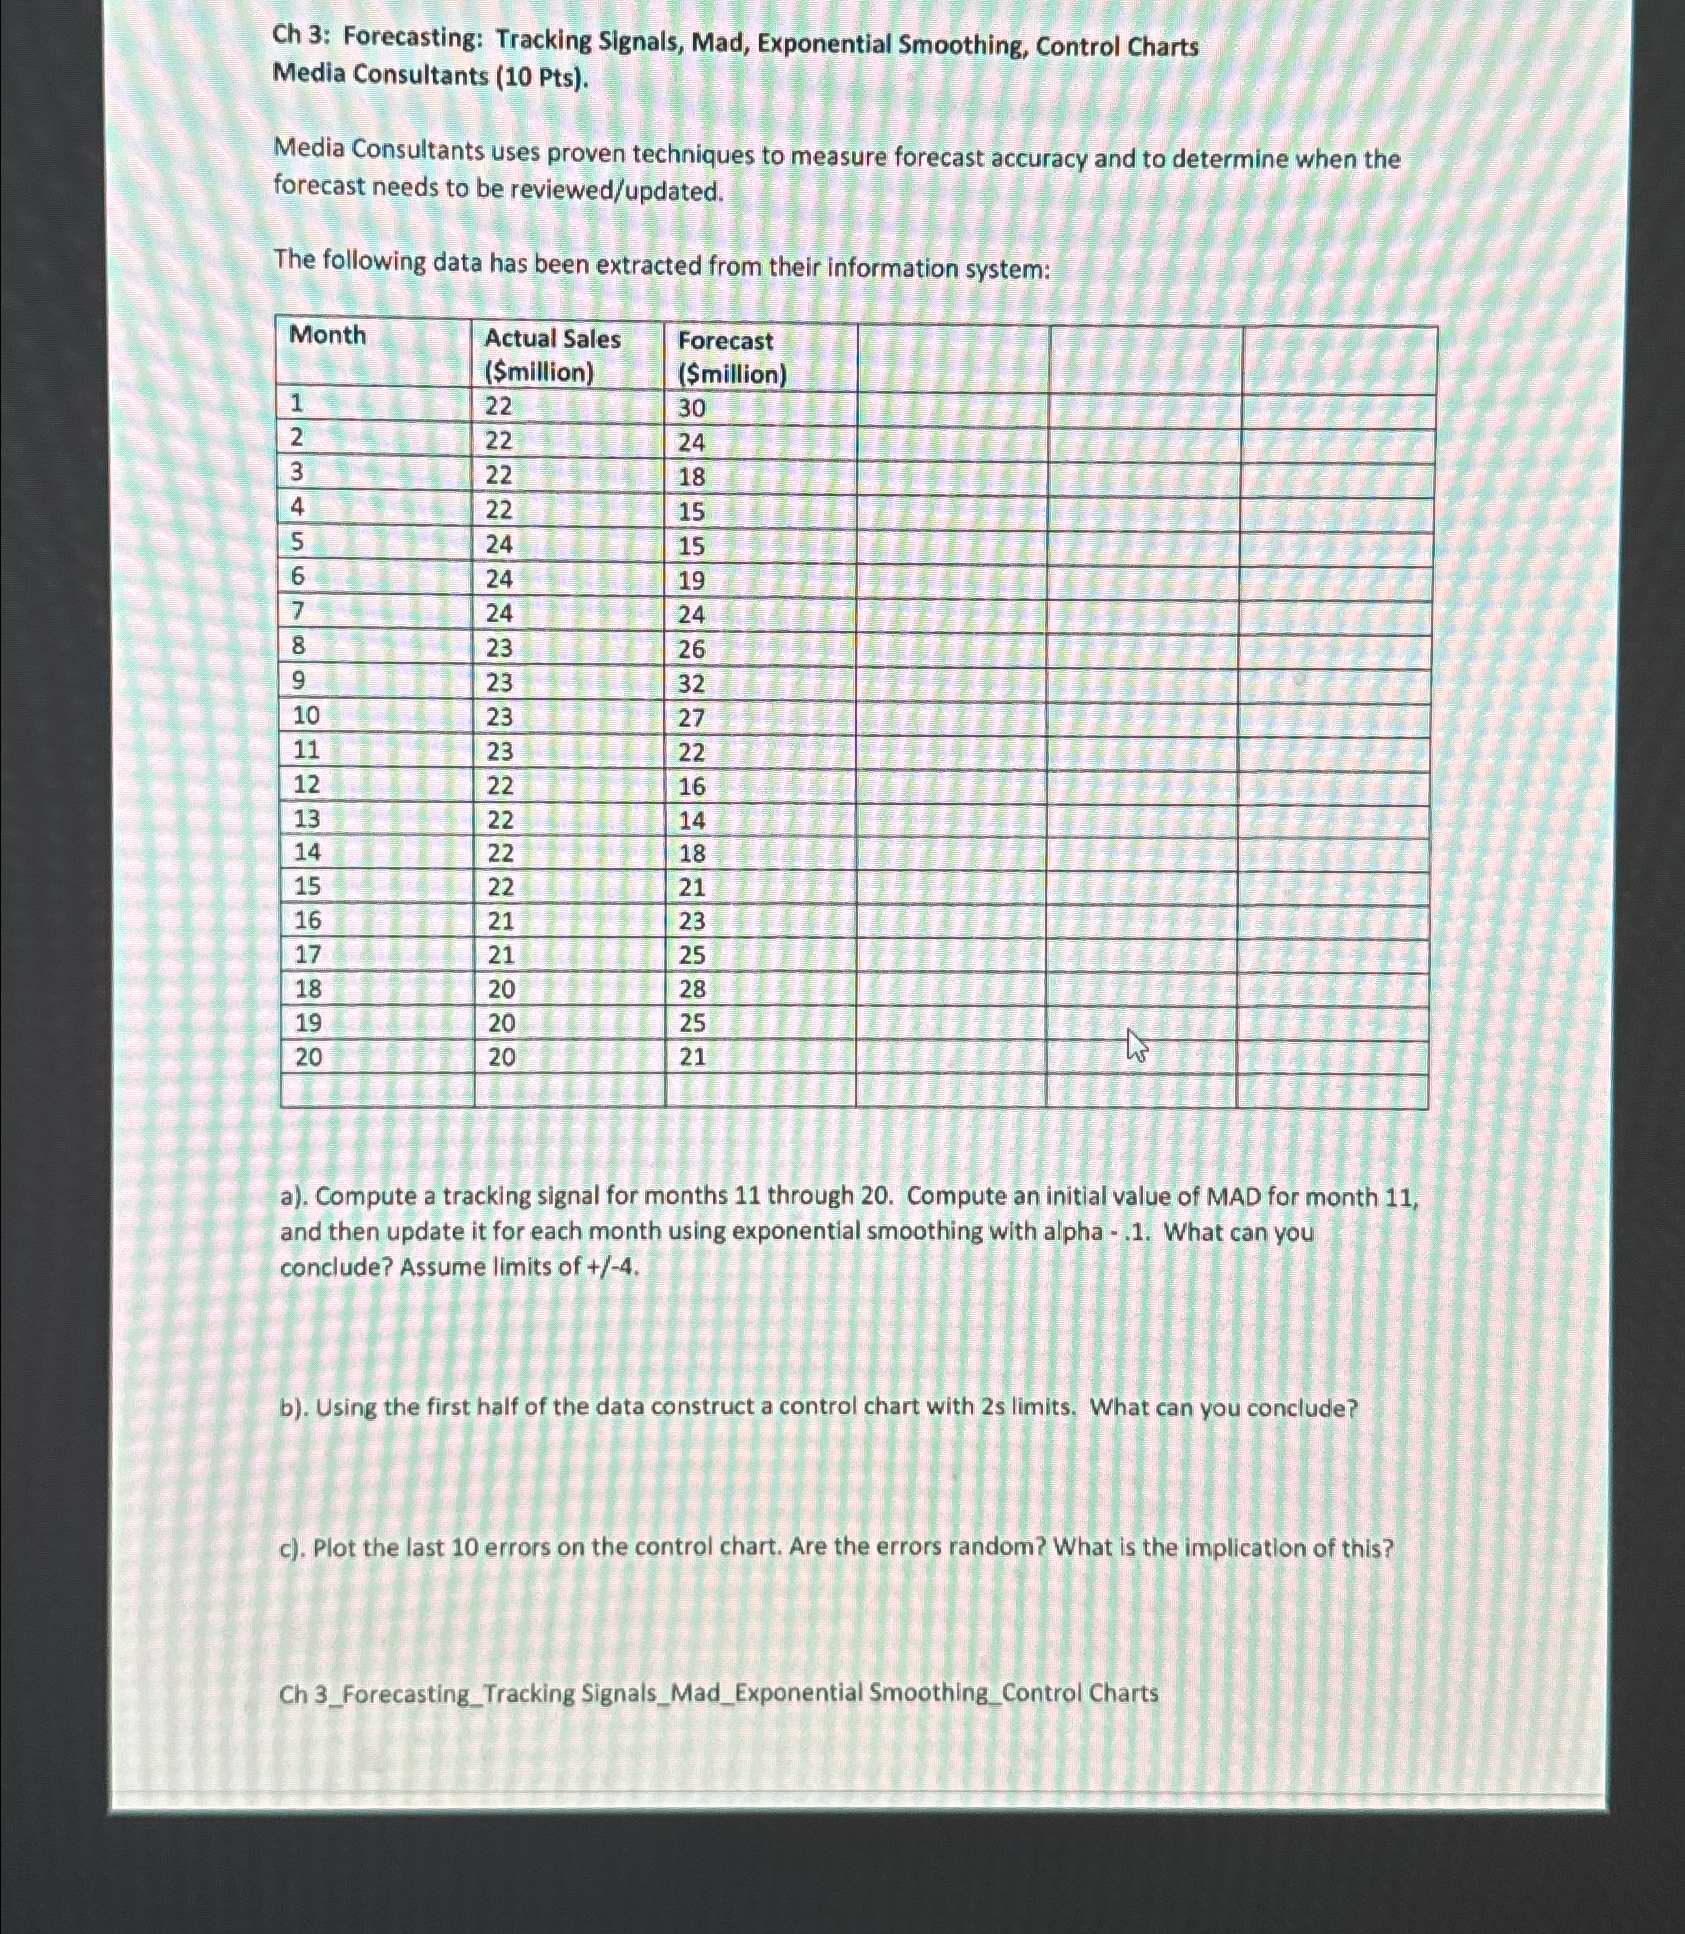
The following data has been extracted from their information system:
tableMonthtableActual SalesSmilliontableForecastSmillion
a Compute a tracking signal for months through Compute an initial value of MAD for month and then update it for each month using exponential smoothing with alpha What can you conclude? Assume limits of
b Using the first half of the data construct a control chart with limits What can you conclude?
c Plot the last errors on the control chart. Are the errors random? What is the implication of this?
Ch ForecastingTracking SignalsMadExponential SmoothingControl Charts
Step by Step Solution
There are 3 Steps involved in it
1 Expert Approved Answer
Step: 1 Unlock

Question Has Been Solved by an Expert!
Get step-by-step solutions from verified subject matter experts
Step: 2 Unlock
Step: 3 Unlock