

Question: Ch 3: Forecasting: Tracking Signals, Mad, Exponential Smoothing, Control Charts Media Consultants (10 Pts). Media Consultants uses proven techniques to measure forecast accuracy and
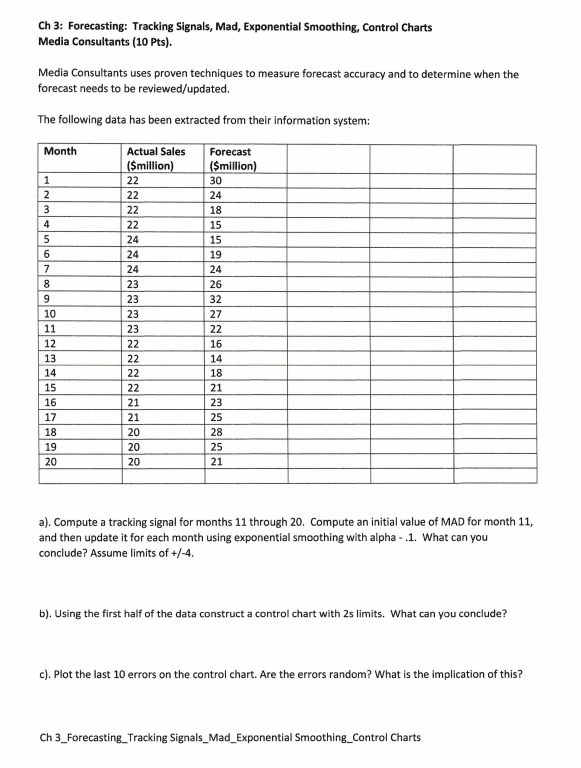
Ch 3: Forecasting: Tracking Signals, Mad, Exponential Smoothing, Control Charts Media Consultants (10 Pts). Media Consultants uses proven techniques to measure forecast accuracy and to determine when the forecast needs to be reviewed/updated. The following data has been extracted from their information system: Month Actual Sales ($million) Forecast ($million) 1 22 30 2 22 24 3 22 18 4 22 15 5 24 15 6 24 19 7 24 24 8 23 26 9 23 32 10 23 27 11 23 22 12 22 16 13 22 14 14 22 18 15 22 21 16 21 23 17 21 18 20 19 20 20 20 2222 25 25 21 a). Compute a tracking signal for months 11 through 20. Compute an initial value of MAD for month 11, and then update it for each month using exponential smoothing with alpha-.1. What can you conclude? Assume limits of +/-4. b). Using the first half of the data construct a control chart with 2s limits. What can you conclude? c). Plot the last 10 errors on the control chart. Are the errors random? What is the implication of this? Ch 3_Forecasting Tracking Signals_Mad_Exponential Smoothing_Control Charts
Step by Step Solution
There are 3 Steps involved in it
Lets solve this stepbystep Part a Compute a Tracking Signal First step is to calculate the Mean Absolute Deviation MAD for month 11 with exponential s... View full answer

Get step-by-step solutions from verified subject matter experts