

Question: Chapter 1. What Economics is About & Appendix A: Pre-Class & In-Class Activities Packet Name/I.D. Number: Section: Date: Part 4. Economic Equations and Graphs .Suppose
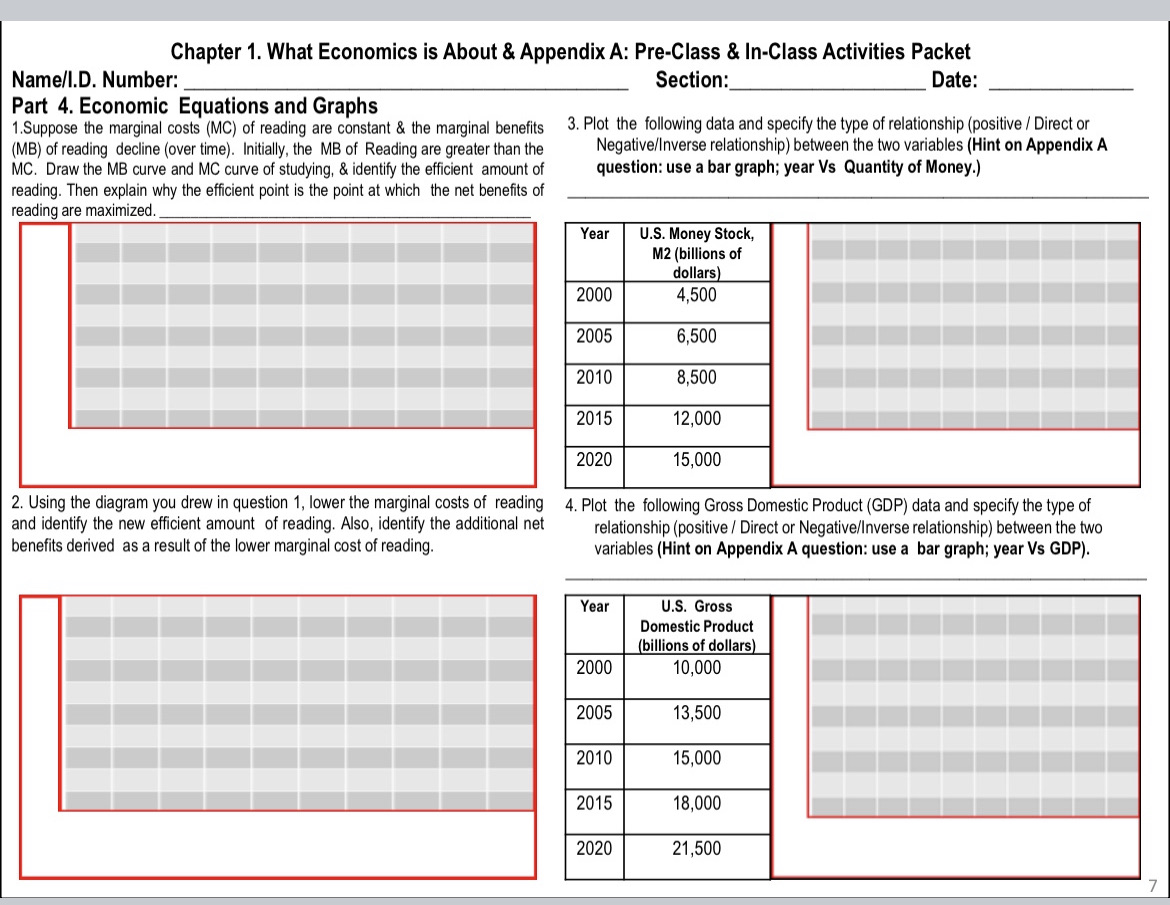
Chapter 1. What Economics is About & Appendix A: Pre-Class & In-Class Activities Packet Name/I.D. Number: Section: Date: Part 4. Economic Equations and Graphs .Suppose the marginal costs (MC) of reading are constant & the marginal benefits 3. Plot the following data and specify the type of relationship (positive / Direct or (MB) of reading decline (over time). Initially, the MB of Reading are greater than the Negative/Inverse relationship) between the two variables (Hint on Appendix A MC. Draw the MB curve and MC curve of studying, & identify the efficient amount of question: use a bar graph; year Vs Quantity of Money.) reading. Then explain why the efficient point is the point at which the net benefits of reading are maximized. Year U.S. Money Stock, M2 (billions of dollars) 2000 4,500 2005 6,500 2010 8.500 2015 12,000 2020 15,000 2. Using the diagram you drew in question 1, lower the marginal costs of reading 4. Plot the following Gross Domestic Product (GDP) data and specify the type of and identify the new efficient amount of reading. Also, identify the additional net relationship (positive / Direct or Negative/Inverse relationship) between the two benefits derived as a result of the lower marginal cost of reading. variables (Hint on Appendix A question: use a bar graph; year Vs GDP). Year U.S. Gross Domestic Product (billions of dollars) 2000 10,000 2005 13,500 2010 15,000 2015 18,000 2020 21,500
Step by Step Solution
There are 3 Steps involved in it

Get step-by-step solutions from verified subject matter experts