Question: Chapter 10: Hypothesis Test for a Difference of 2 Means (Independen Score: 0/16 Answered: 0/4 Question 1 Does the average Presbyterian donate more than the
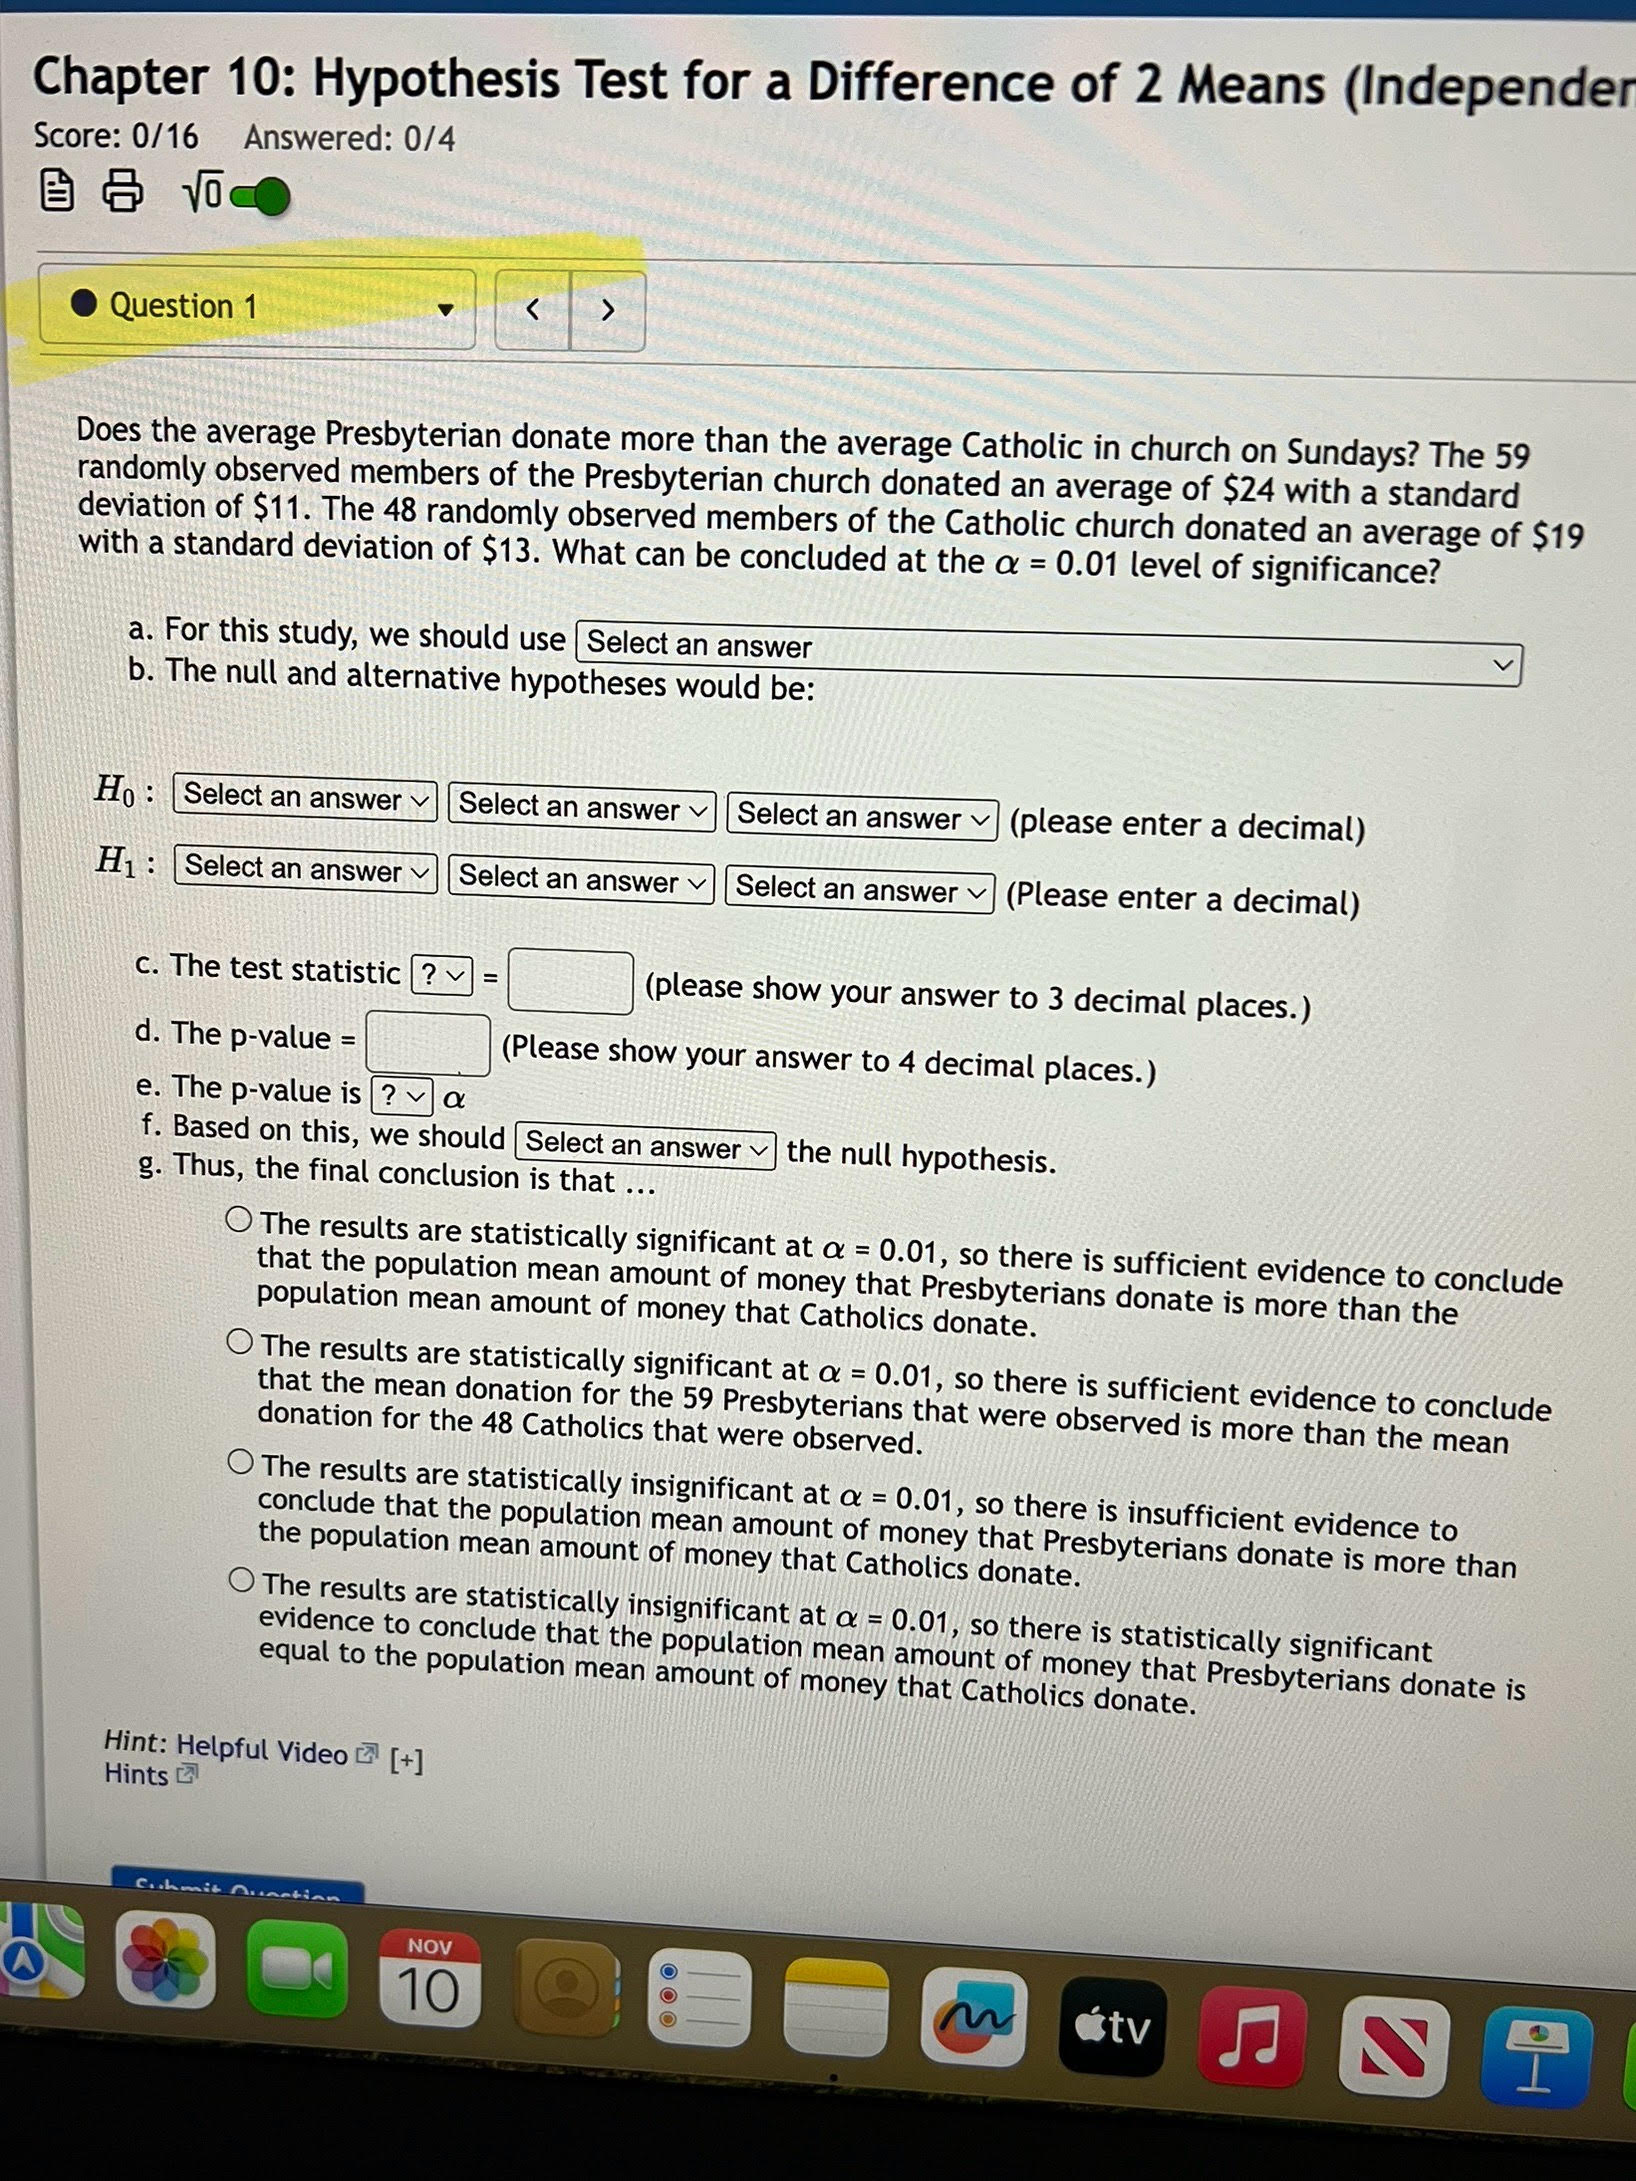
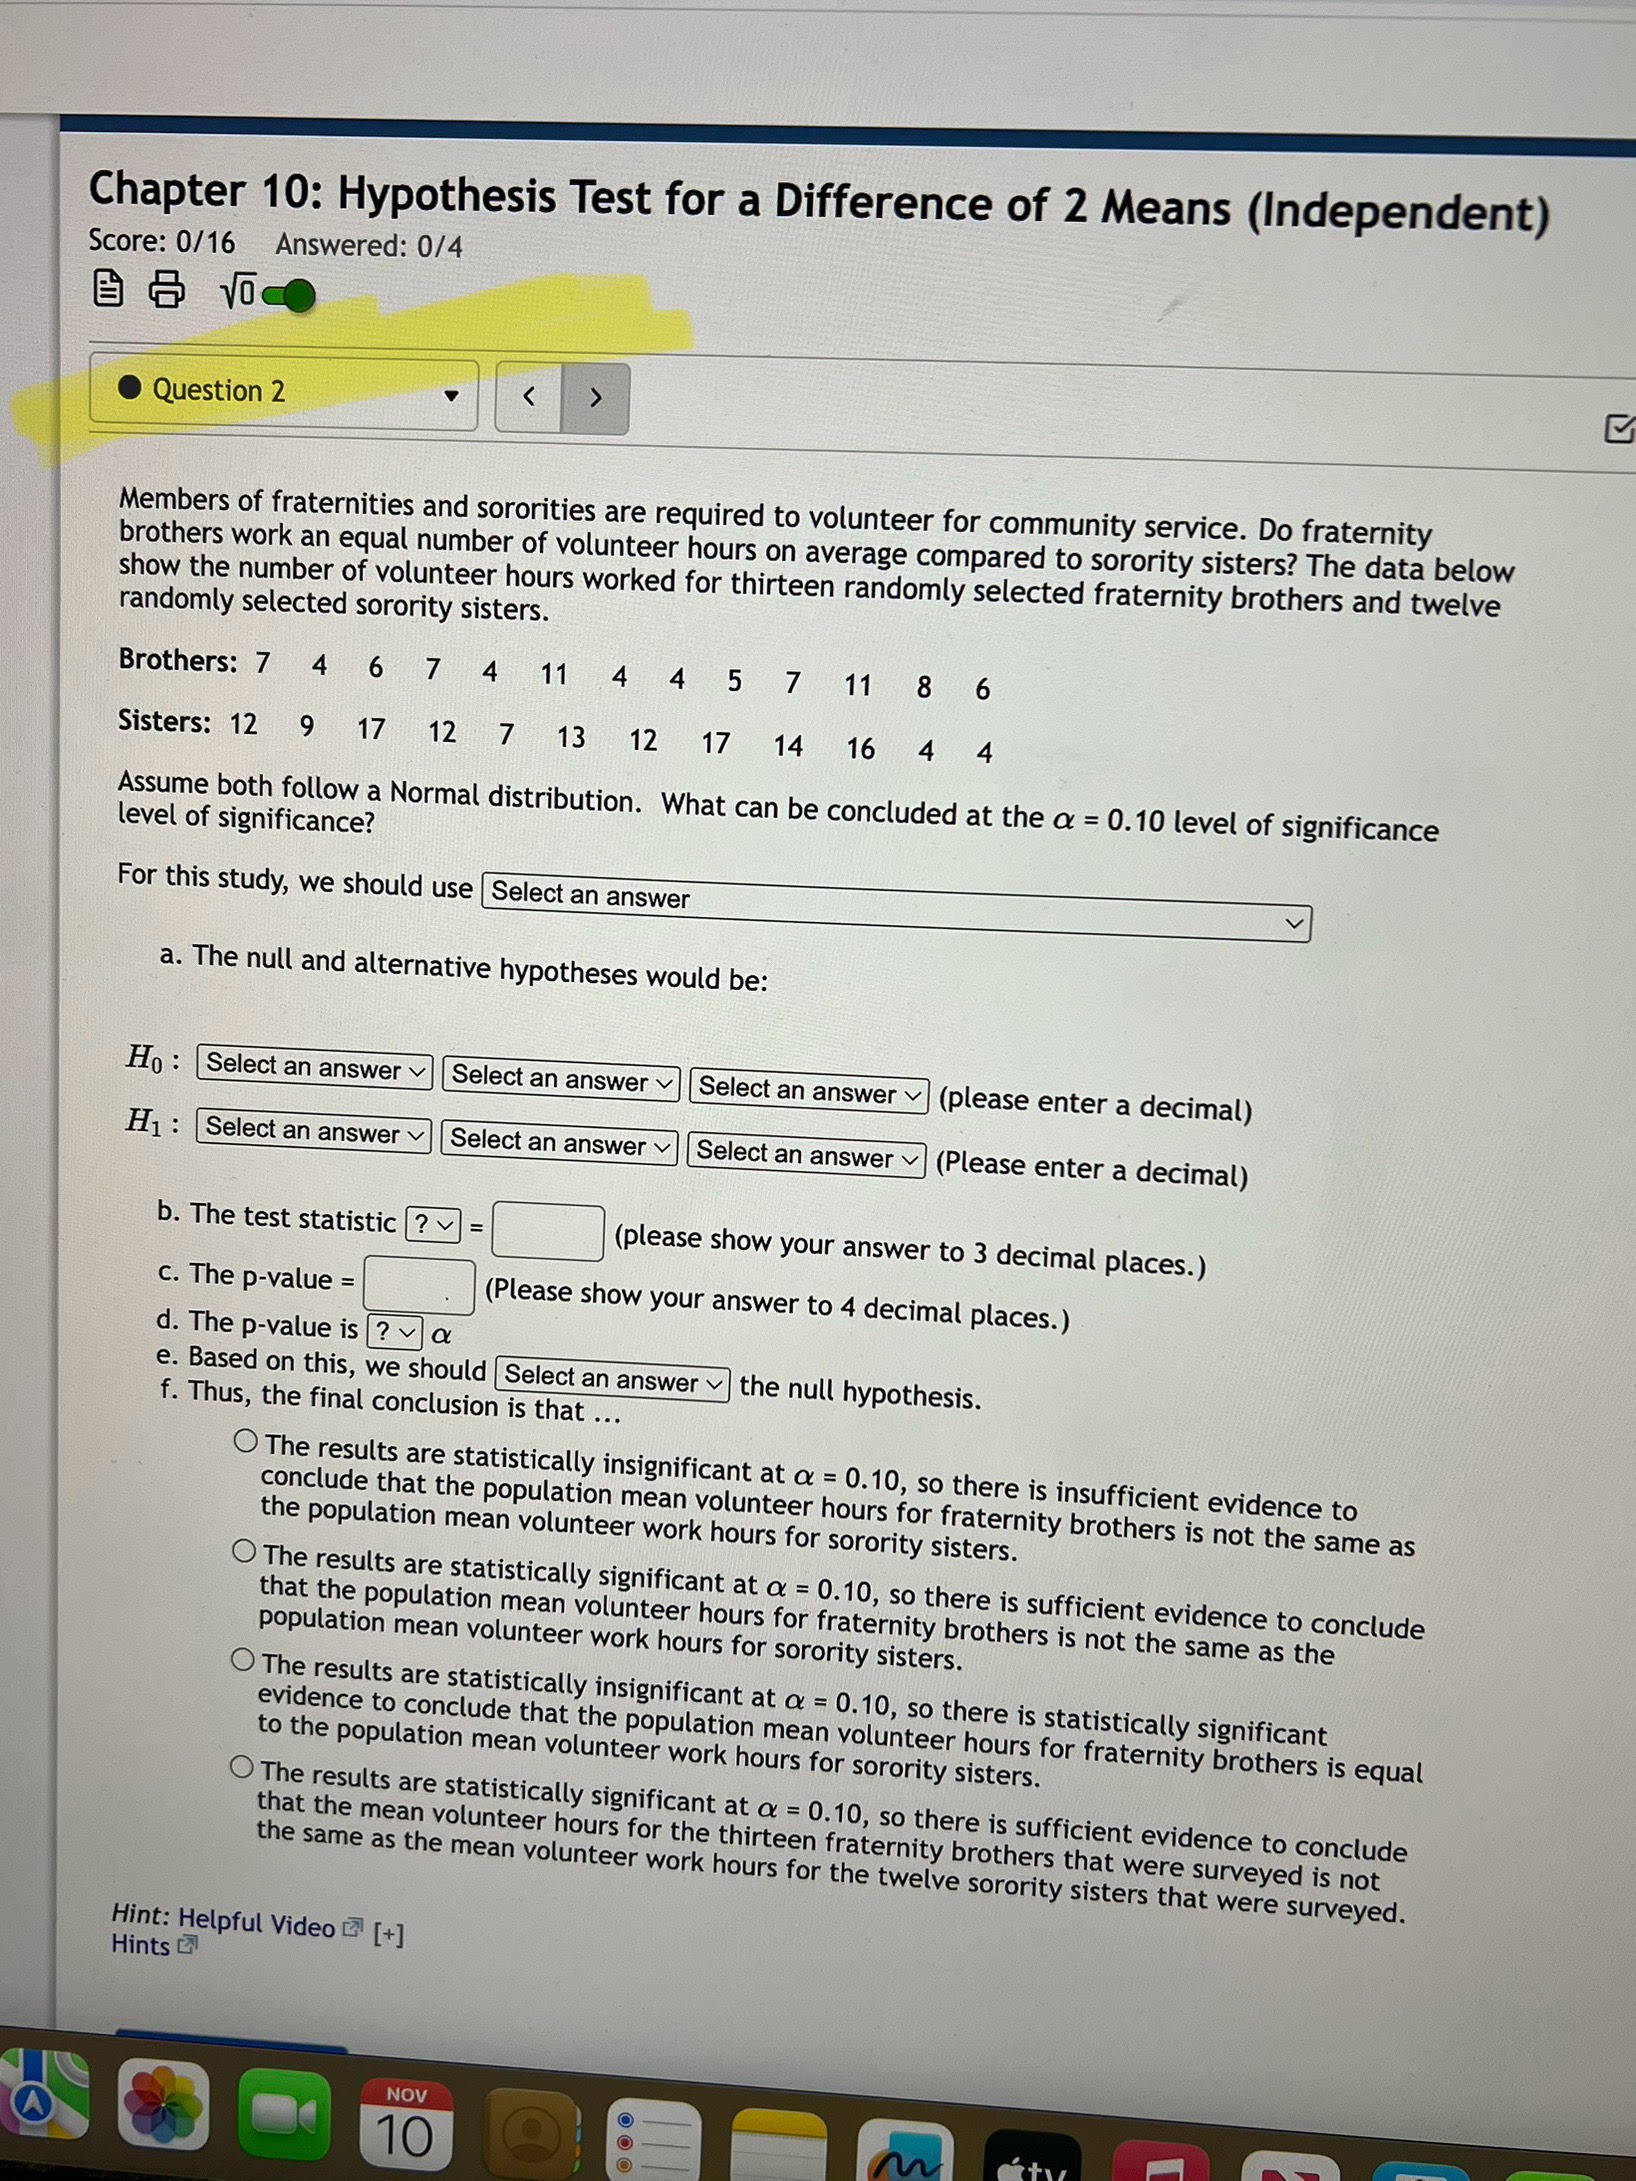
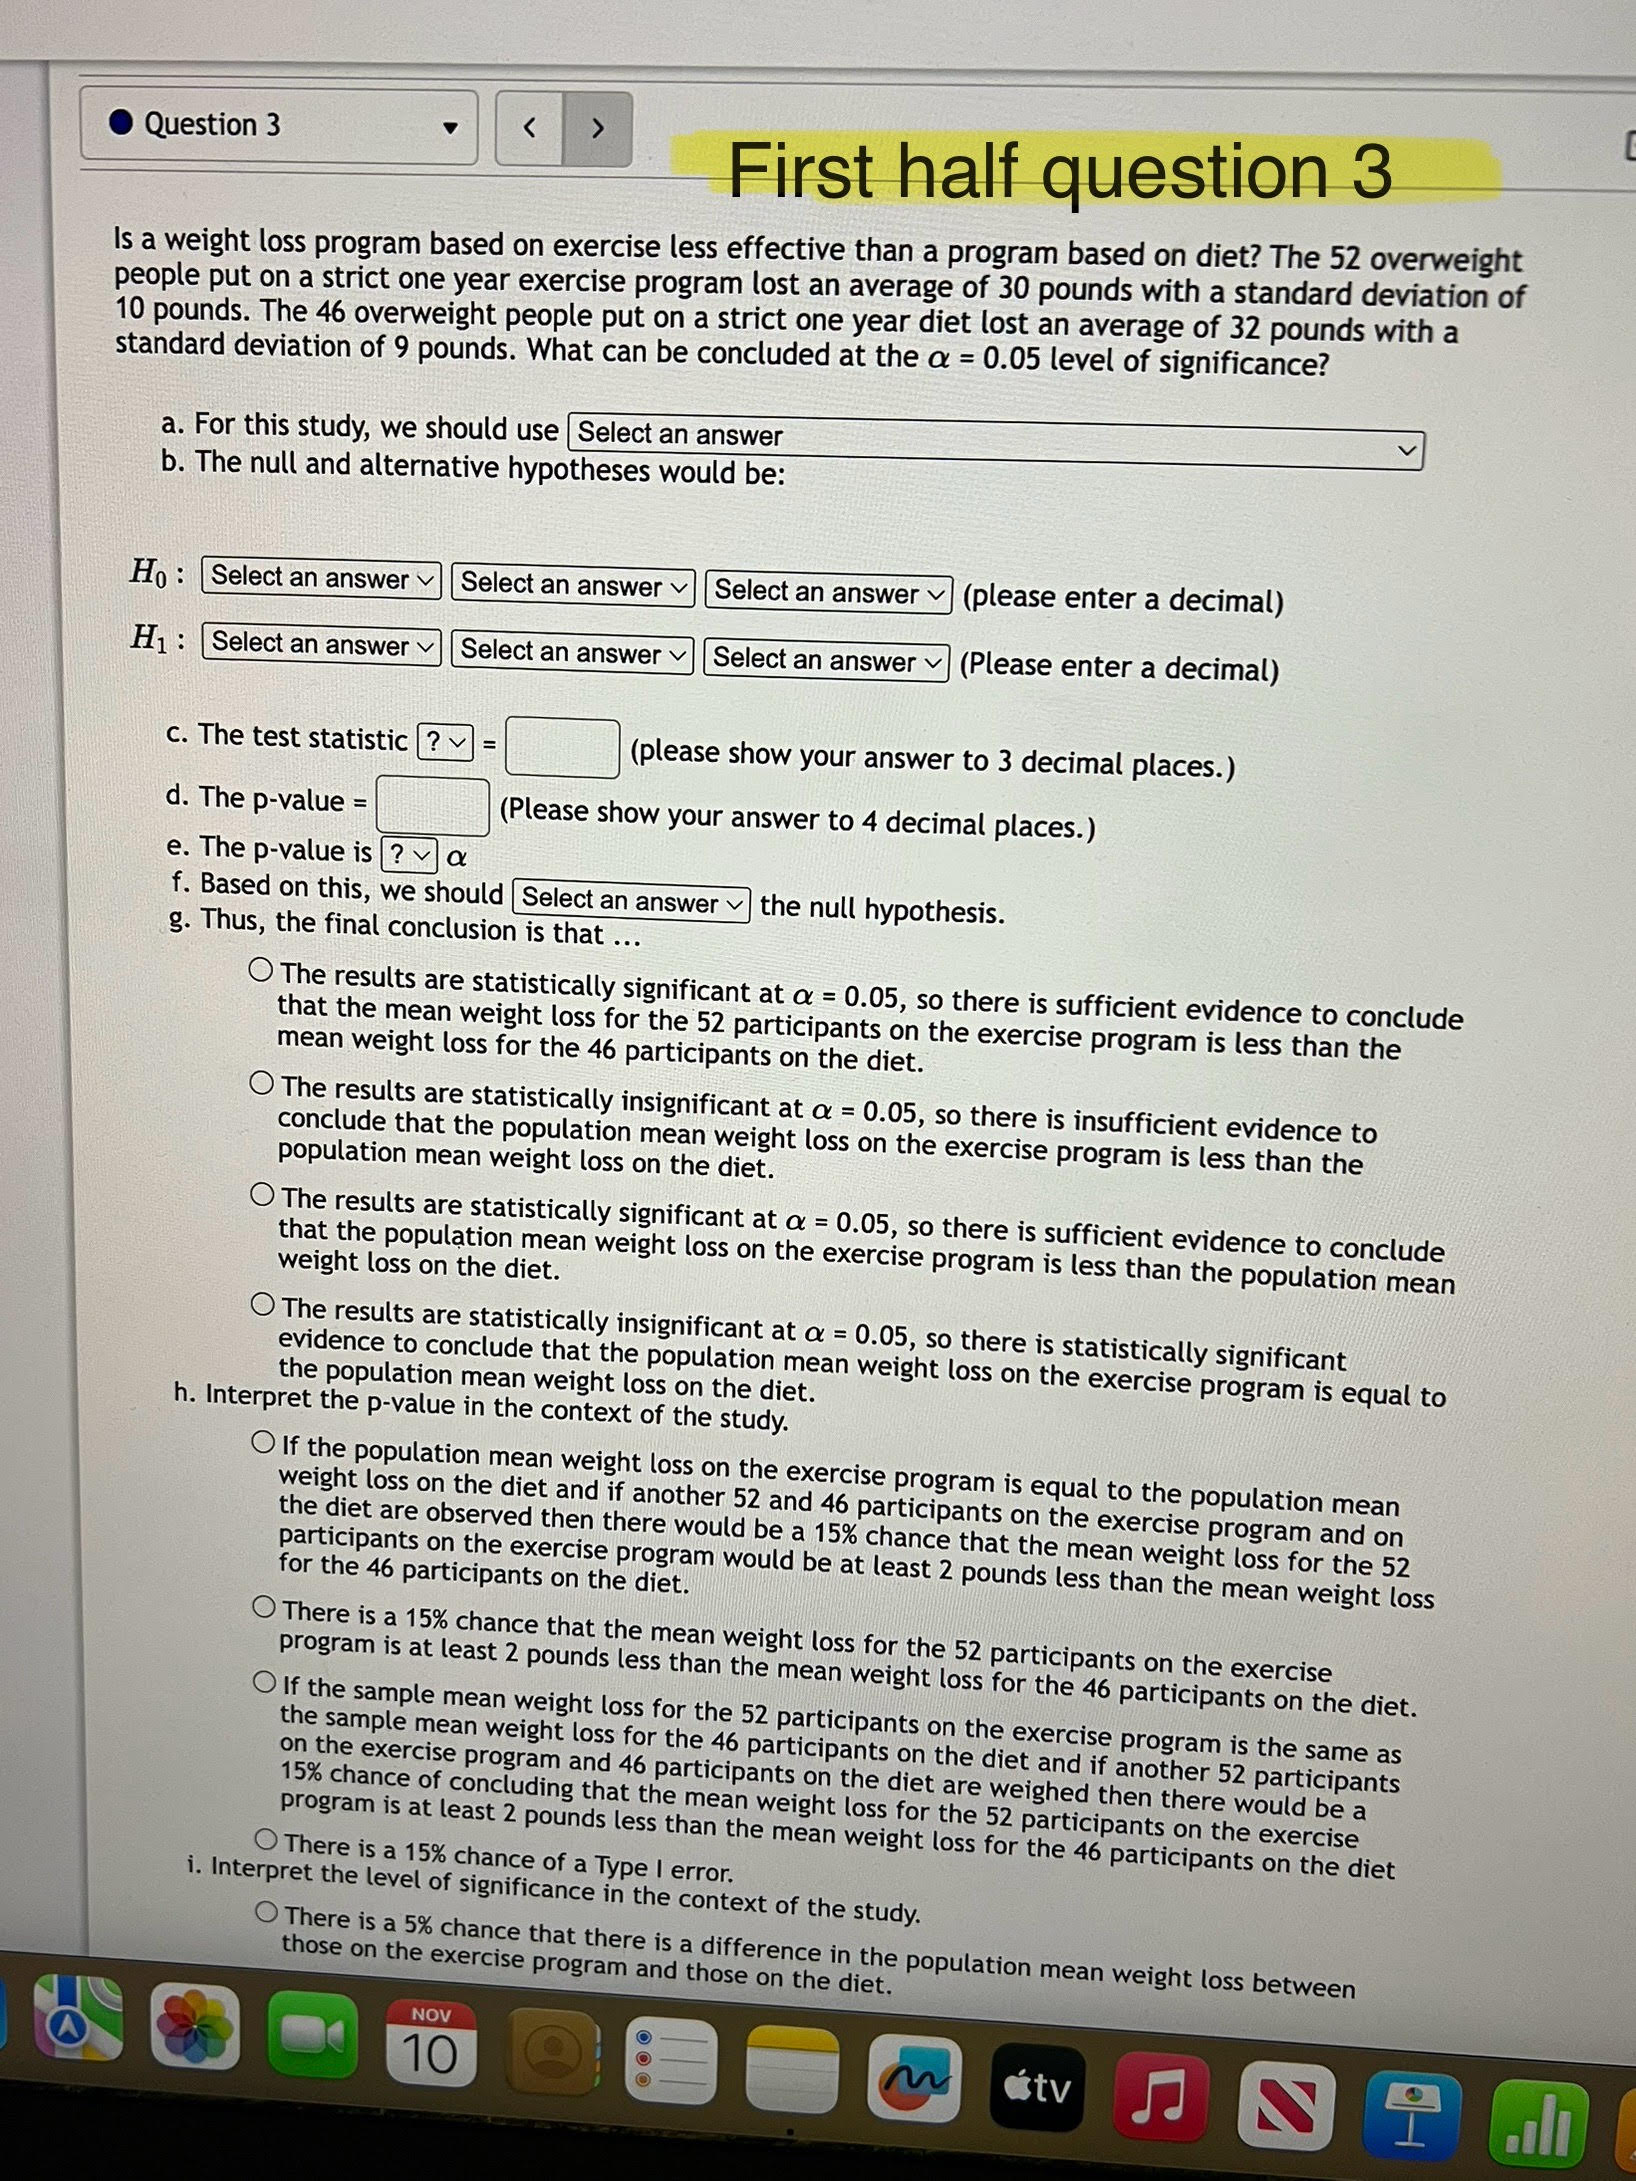
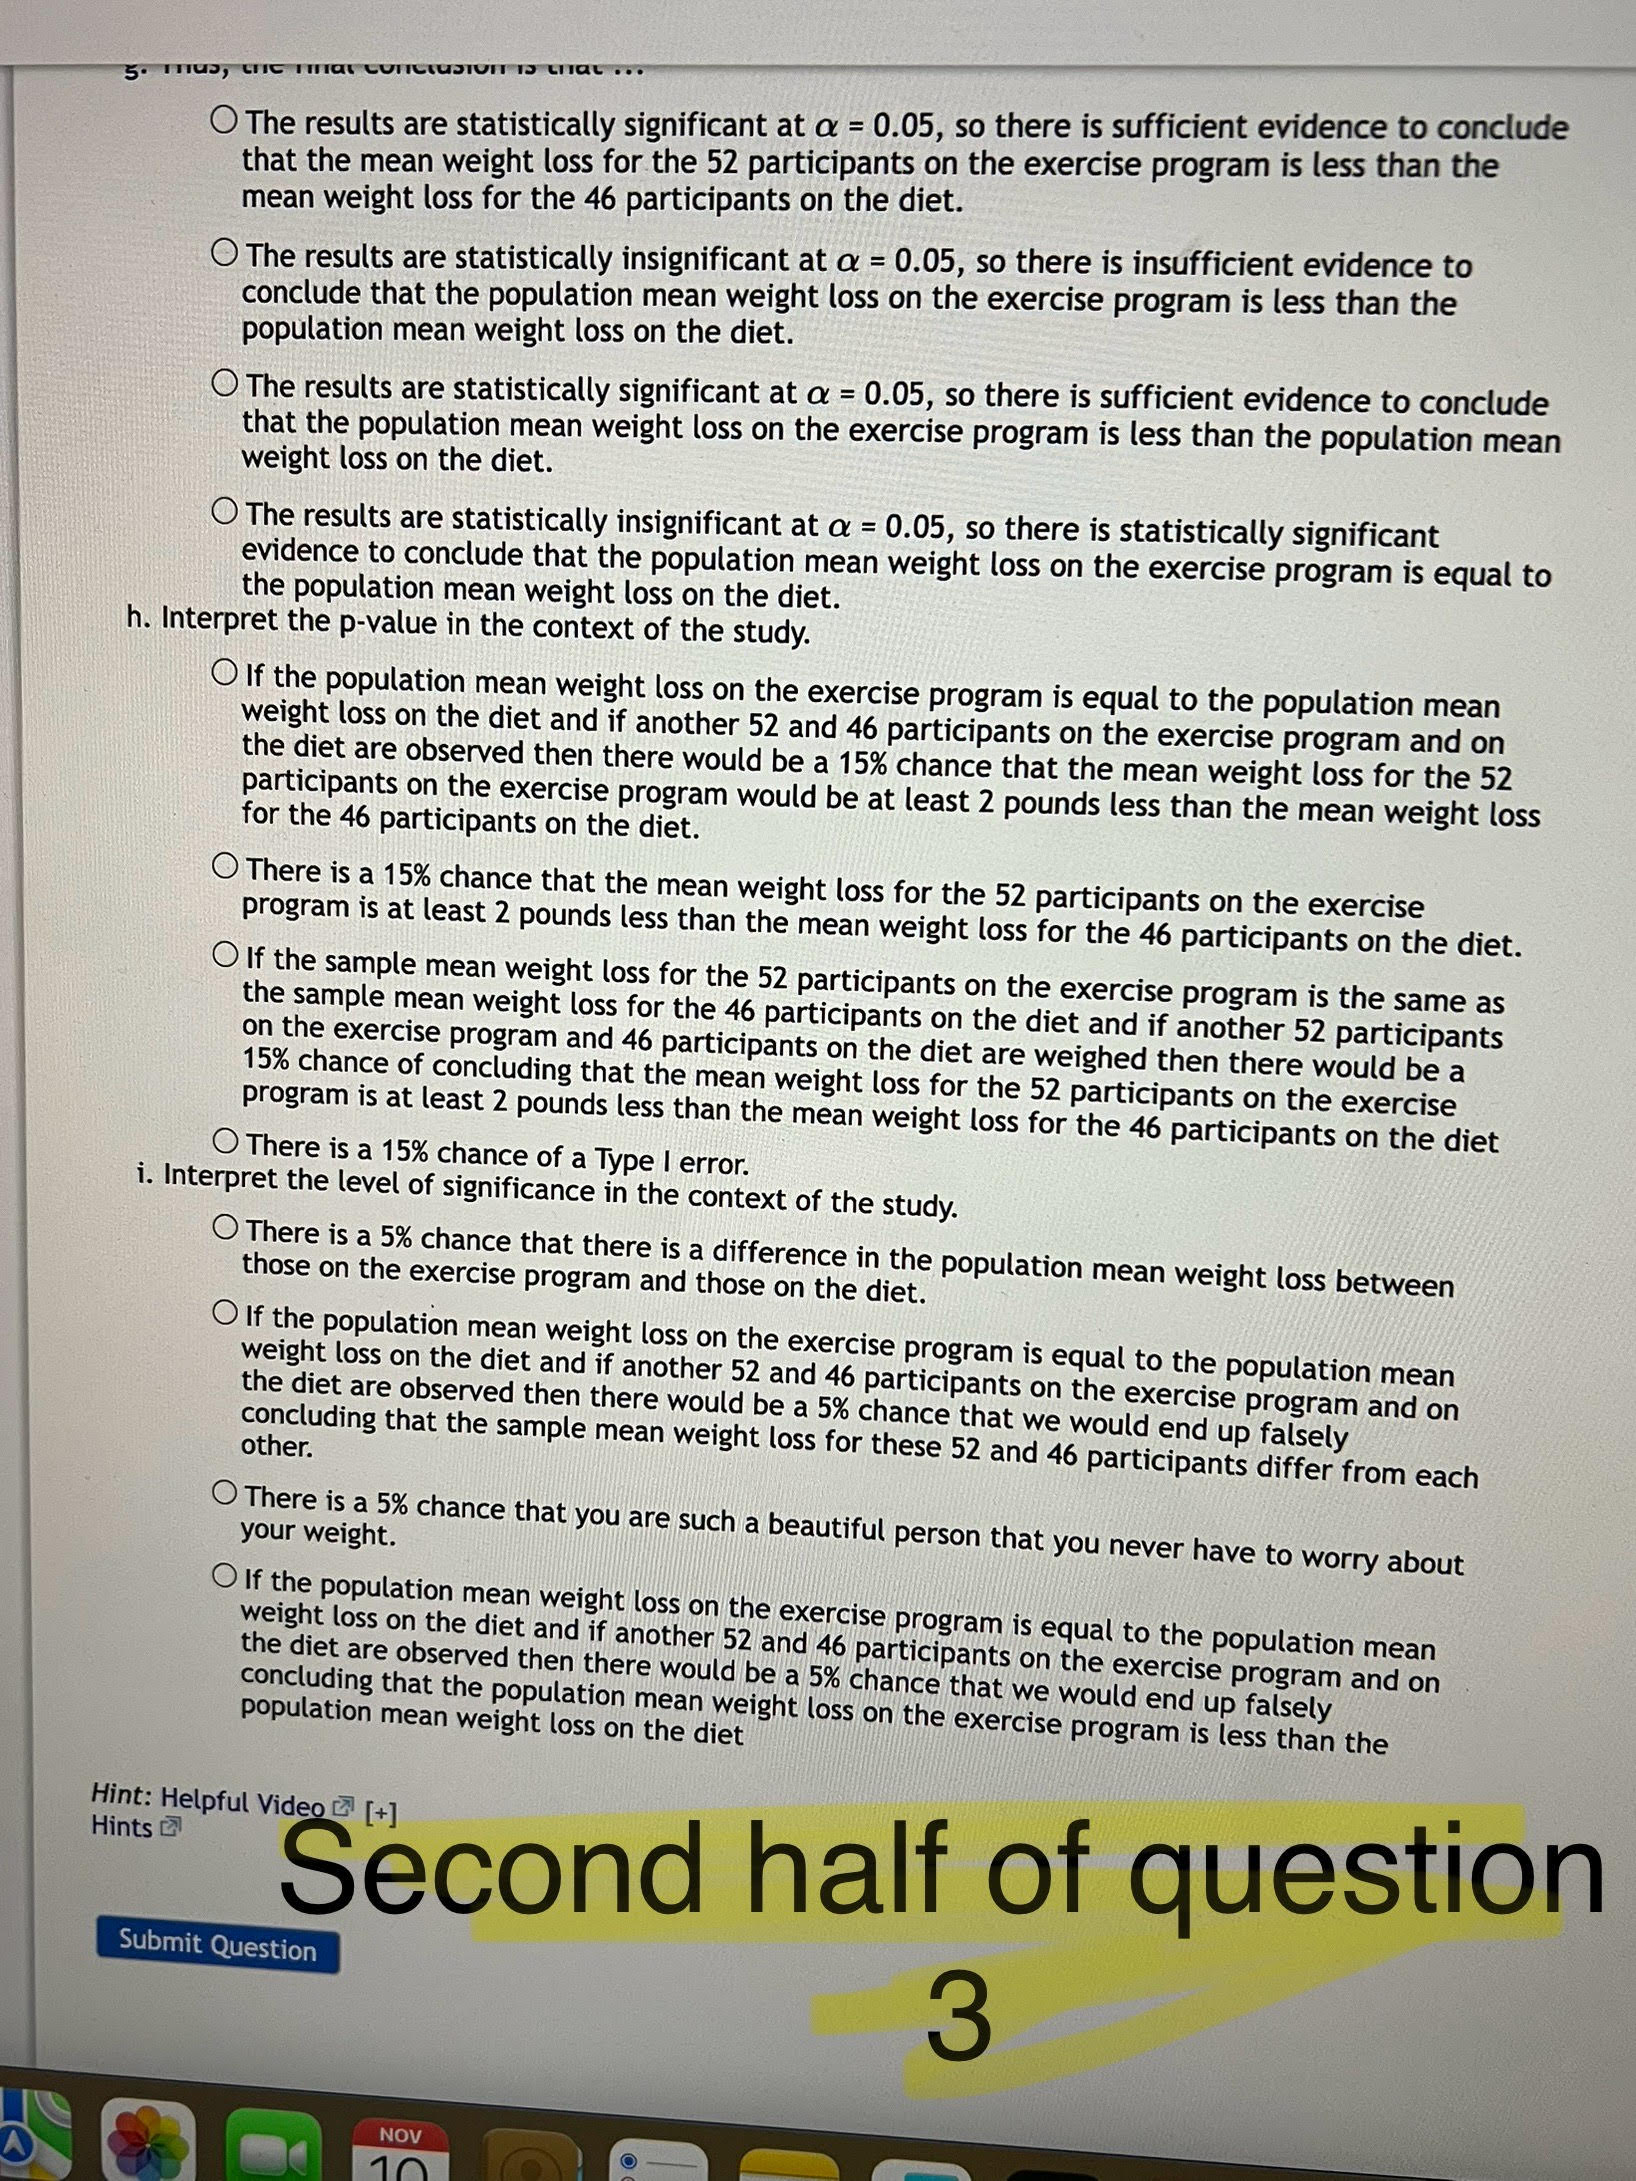
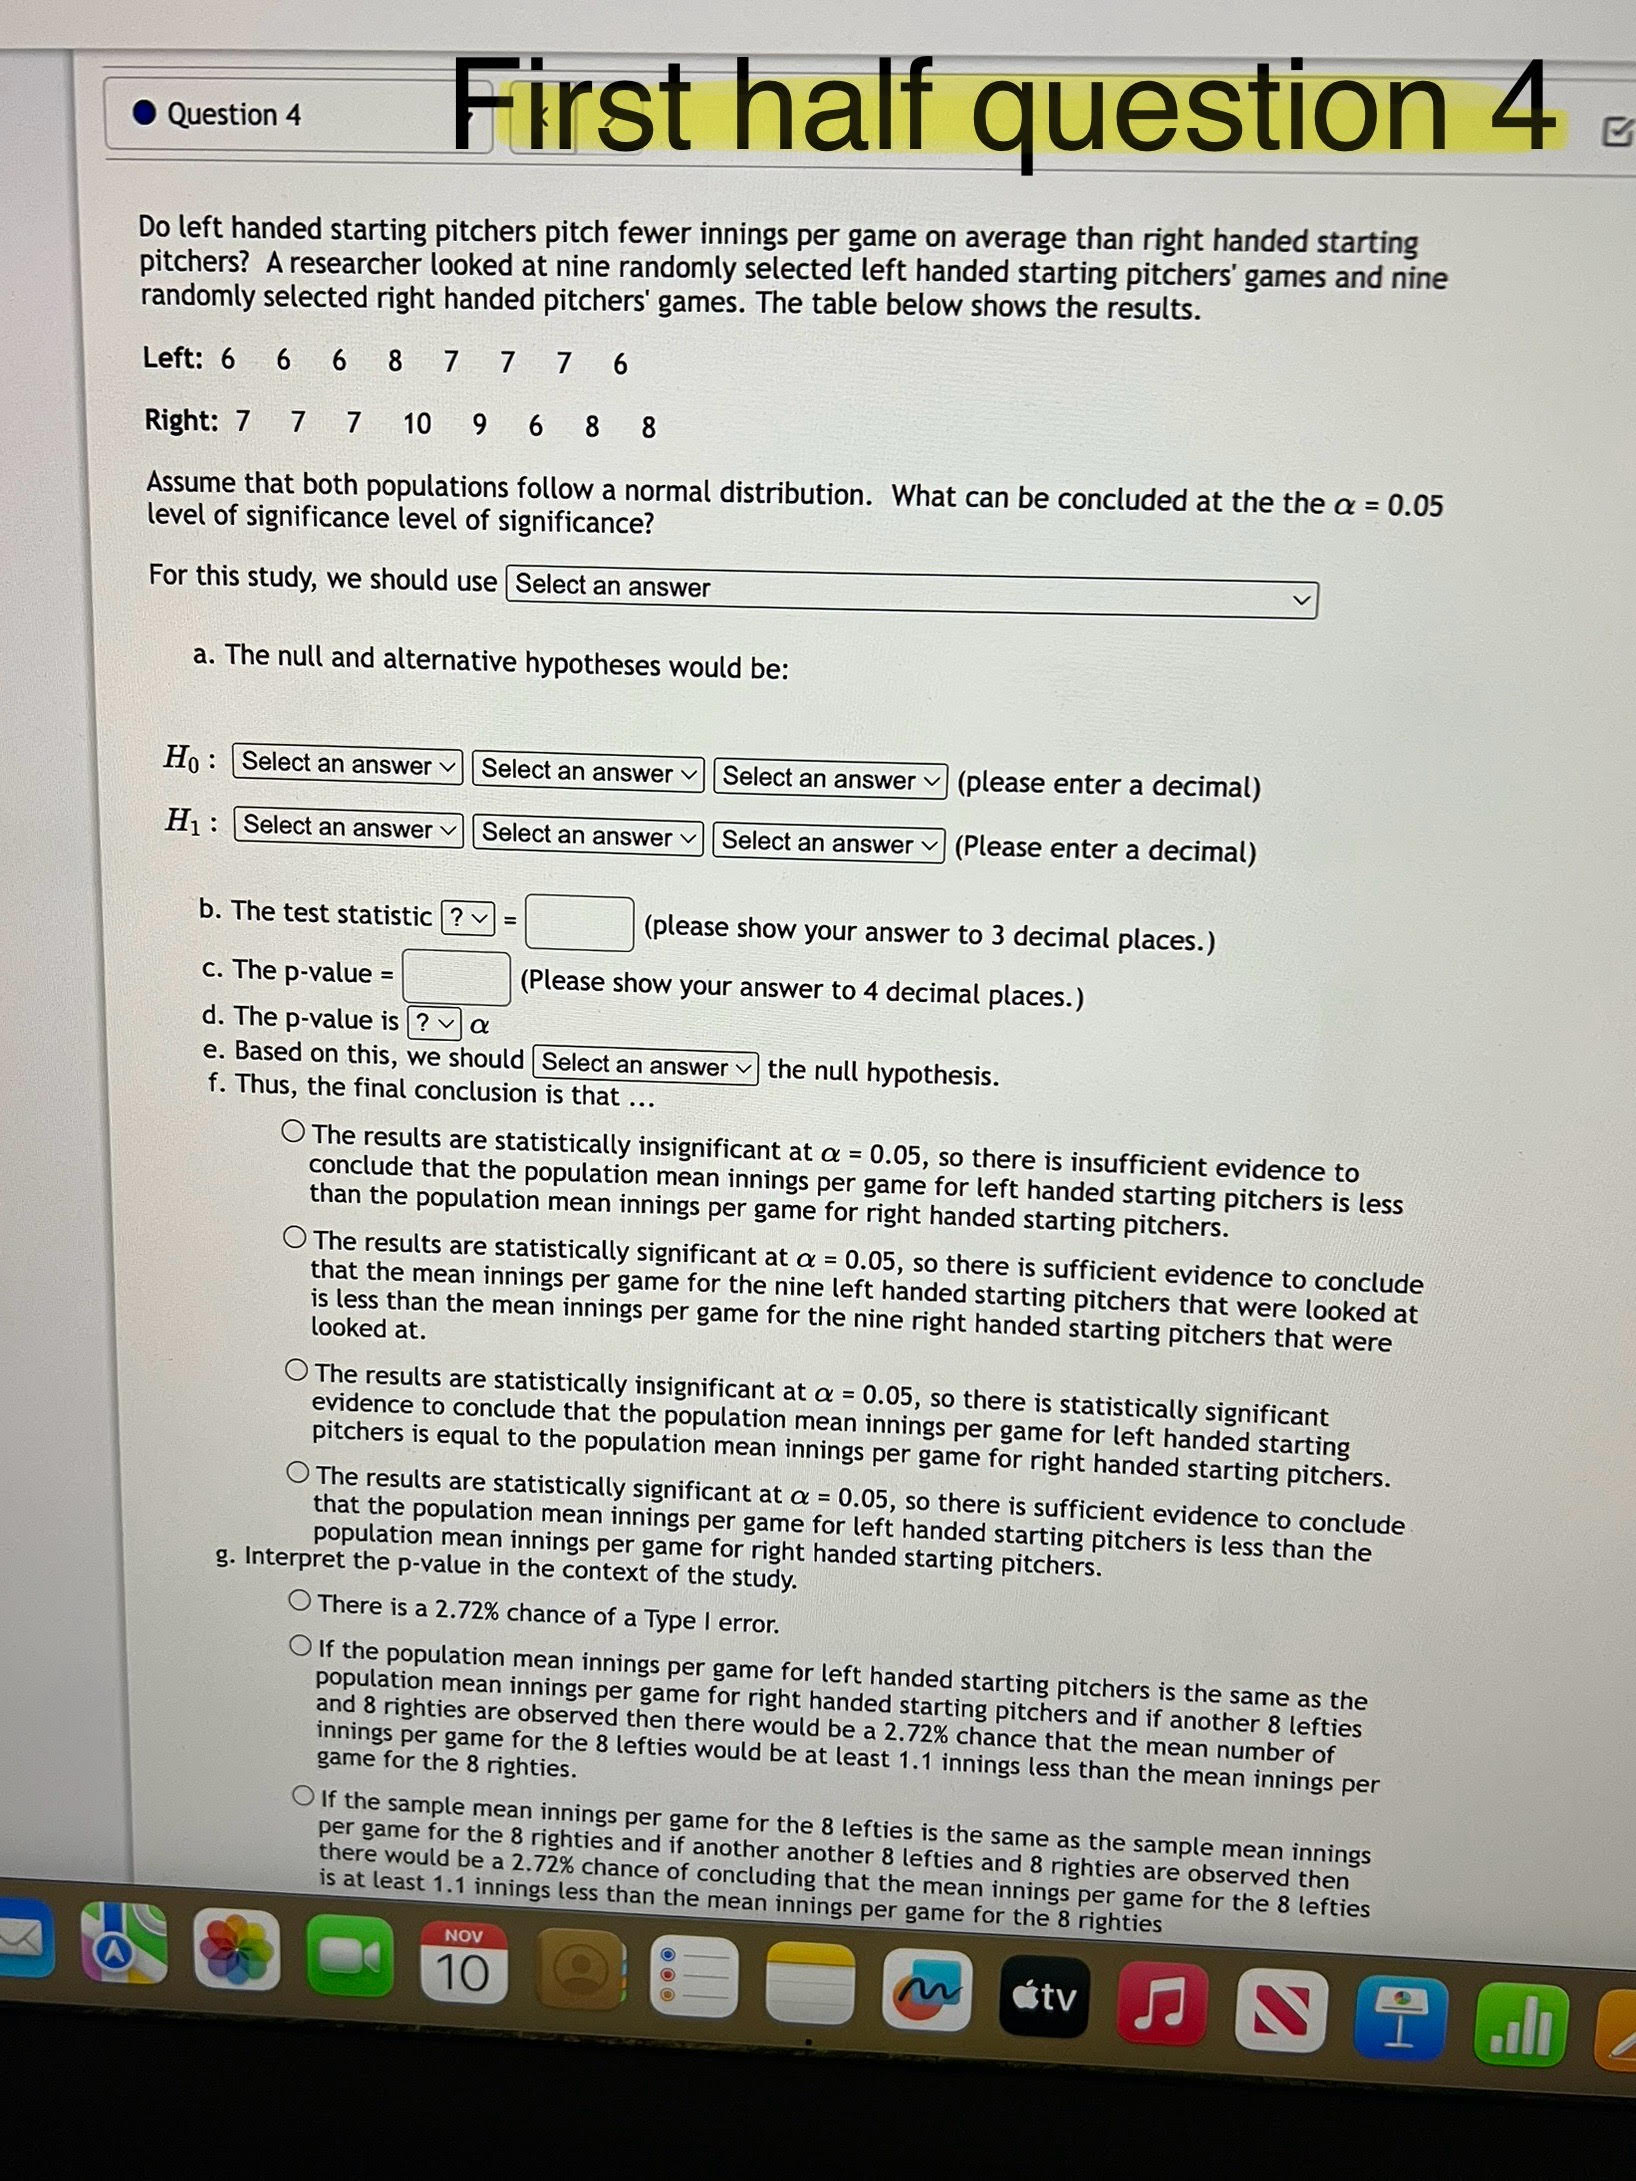
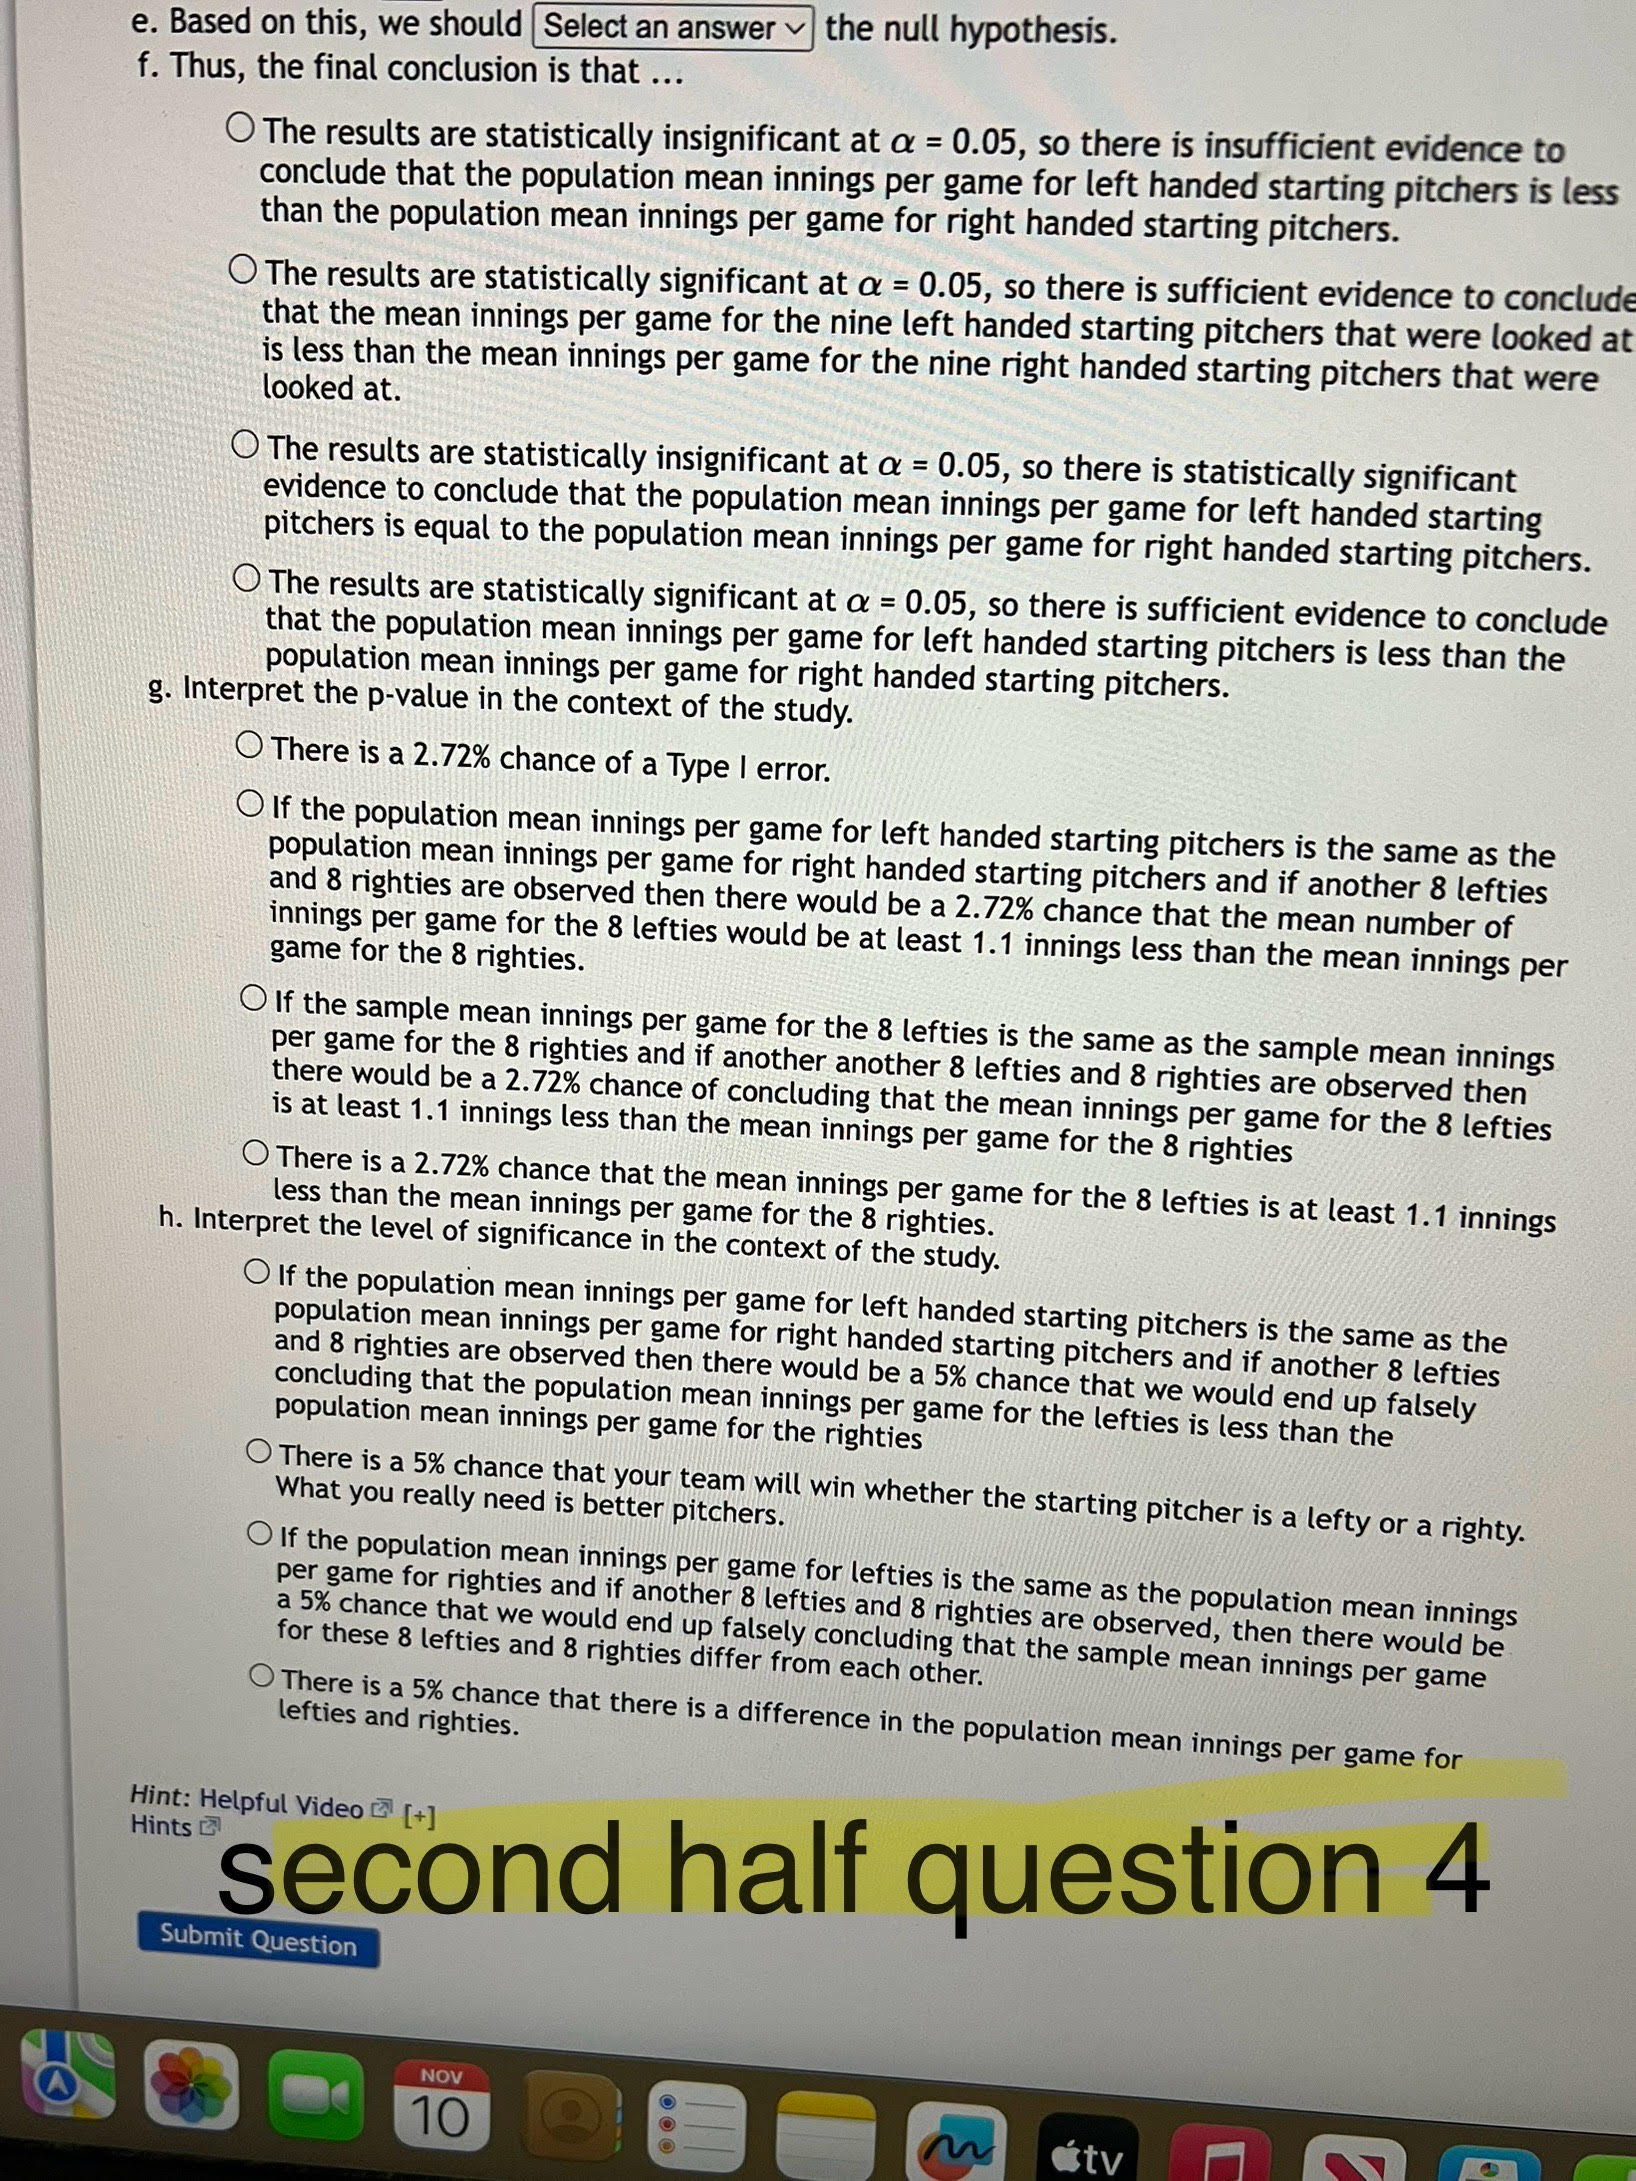
Chapter 10: Hypothesis Test for a Difference of 2 Means (Independen Score: 0/16 Answered: 0/4 Question 1 Does the average Presbyterian donate more than the average Catholic in church on Sundays? The 59 randomly observed members of the Presbyterian church donated an average of $24 with a standard deviation of $11. The 48 randomly observed members of the Catholic church donated an average of $19 with a standard deviation of $13. What can be concluded at the a = 0.01 level of significance? a. For this study, we should use |Select an answer b. The null and alternative hypotheses would be: Ho : Select an answer Select an answer | |Select an answer | (please enter a decimal) H1 : Select an answer v Select an answer Select an answer | (Please enter a decimal) c. The test statistic |? = (please show your answer to 3 decimal places.) d. The p-value = (Please show your answer to 4 decimal places.) e. The p-value is ? v a f. Based on this, we should |Select an answer v | the null hypothesis. g. Thus, the final conclusion is that ... The results are statistically significant at a = 0.01, so there is sufficient evidence to conclude that the population mean amount of money that Presbyterians donate is more than the population mean amount of money that Catholics donate. The results are statistically significant at a = 0.01, so there is sufficient evidence to conclude that the mean donation for the 59 Presbyterians that were observed is more than the mean donation for the 48 Catholics that were observed. The results are statistically insignificant at a = 0.01, so there is insufficient evidence to conclude that the population mean amount of money that Presbyterians donate is more than the population mean amount of money that Catholics donate. The results are statistically insignificant at a = 0.01, so there is statistically significant evidence to conclude that the population mean amount of money that Presbyterians donate is equal to the population mean amount of money that Catholics donate. Hint: Helpful Video ) [+] Hints Cobmit Auction NOV D 10 tvChapter 10: Hypothesis Test for a Difference of 2 Means (Independent) Score: 0/16 Answered: 0/4 Question 2 Members of fraternities and sororities are required to volunteer for community service. Do fraternity brothers work an equal number of volunteer hours on average compared to sorority sisters? The data below show the number of volunteer hours worked for thirteen randomly selected fraternity brothers and twelve randomly selected sorority sisters. Brothers: 7 4 6 7 11 4 4 5 7 11 8 Sisters: 12 9 17 12 7 13 12 17 14 16 Assume both follow a Normal distribution. What can be concluded at the a = 0.10 level of significance level of significance? For this study, we should use |Select an answer a. The null and alternative hypotheses would be: Ho : Select an answer Select an answer v Select an answer | (please enter a decimal) H1 : Select an answer | Select an answer v Select an answer | (Please enter a decimal) b. The test statistic ? = (please show your answer to 3 decimal places.) c. The p-value = (Please show your answer to 4 decimal places.) d. The p-value is ? a e. Based on this, we should Select an answer | the null hypothesis. f. Thus, the final conclusion is that ... The results are statistically insignificant at a = 0.10, so there is insufficient evidence to conclude that the population mean volunteer hours for fraternity brothers is not the same as the population mean volunteer work hours for sorority sisters. The results are statistically significant at a = 0.10, so there is sufficient evidence to conclude that the population mean volunteer hours for fraternity brothers is not the same as the population mean volunteer work hours for sorority sisters. The results are statistically insignificant at o = 0.10, so there is statistically significant evidence to conclude that the population mean volunteer hours for fraternity brothers is equal to the population mean volunteer work hours for sorority sisters. The results are statistically significant at o = 0.10, so there is sufficient evidence to conclude that the mean volunteer hours for the thirteen fraternity brothers that were surveyed is not the same as the mean volunteer work hours for the twelve sorority sisters that were surveyed. Hint: Helpful Video ' [+] Hints NOV 10Question 3 First half question 3 Is a weight loss program based on exercise less effective than a program based on diet? The 52 overweight people put on a strict one year exercise program lost an average of 30 pounds with a standard deviation of 10 pounds. The 46 overweight people put on a strict one year diet lost an average of 32 pounds with a standard deviation of 9 pounds. What can be concluded at the a = 0.05 level of significance? a. For this study, we should use |Select an answer b. The null and alternative hypotheses would be: Ho : Select an answer Select an answer Select an answer | (please enter a decimal) H1 : Select an answer v Select an answer Select an answer v (Please enter a decimal) c. The test statistic |? ) = (please show your answer to 3 decimal places.) d. The p-value = (Please show your answer to 4 decimal places.) e. The p-value is ? v a f. Based on this, we should |Select an answer | the null hypothesis. g. Thus, the final conclusion is that ... The results are statistically significant at a = 0.05, so there is sufficient evidence to conclude that the mean weight loss for the 52 participants on the exercise program is less than the mean weight loss for the 46 participants on the diet. The results are statistically insignificant at a = 0.05, so there is insufficient evidence to conclude that the population mean weight loss on the exercise program is less than the population mean weight loss on the diet. The results are statistically significant at a = 0.05, so there is sufficient evidence to conclude that the population mean weight loss on the exercise program is less than the population mean weight loss on the diet. The results are statistically insignificant at o = 0.05, so there is statistically significant evidence to conclude that the population mean weight loss on the exercise program is equal to the population mean weight loss on the diet. h. Interpret the p-value in the context of the study. If the population mean weight loss on the exercise program is equal to the population mean weight loss on the diet and if another 52 and 46 participants on the exercise program and on the diet are observed then there would be a 15% chance that the mean weight loss for the 52 participants on the exercise program would be at least 2 pounds less than the mean weight loss for the 46 participants on the diet. There is a 15% chance that the mean weight loss for the 52 participants on the exercise program is at least 2 pounds less than the mean weight loss for the 46 participants on the diet. If the sample mean weight loss for the 52 participants on the exercise program is the same as the sample mean weight loss for the 46 participants on the diet and if another 52 participants on the exercise program and 46 participants on the diet are weighed then there would be a 15%% chance of concluding that the mean weight loss for the 52 participants on the exercise program is at least 2 pounds less than the mean weight loss for the 46 participants on the diet O There is a 15% chance of a Type | error. i. Interpret the level of significance in the context of the study. There is a 5%% chance that there is a difference in the population mean weight loss between those on the exercise program and those on the diet. NOV 10 atvO The results are statistically significant at a = 0.05, so there is sufficient evidence to conclude that the mean weight loss for the 52 participants on the exercise program is less than the mean weight loss for the 46 participants on the diet. O The results are statistically insignificant at a = 0.05, so there is insufficient evidence to conclude that the population mean weight loss on the exercise program is less than the population mean weight loss on the diet. The results are statistically significant at a = 0.05, so there is sufficient evidence to conclude that the population mean weight loss on the exercise program is less than the population mean weight loss on the diet. The results are statistically insignificant at a = 0.05, so there is statistically significant evidence to conclude that the population mean weight loss on the exercise program is equal to the population mean weight loss on the diet. h. Interpret the p-value in the context of the study. If the population mean weight loss on the exercise program is equal to the population mean weight loss on the diet and if another 52 and 46 participants on the exercise program and on the diet are observed then there would be a 15% chance that the mean weight loss for the 52 participants on the exercise program would be at least 2 pounds less than the mean weight loss for the 46 participants on the diet. There is a 15% chance that the mean weight loss for the 52 participants on the exercise program is at least 2 pounds less than the mean weight loss for the 46 participants on the diet. O If the sample mean weight loss for the 52 participants on the exercise program is the same as the sample mean weight loss for the 46 participants on the diet and if another 52 participants on the exercise program and 46 participants on the diet are weighed then there would be a 15% chance of concluding that the mean weight loss for the 52 participants on the exercise program is at least 2 pounds less than the mean weight loss for the 46 participants on the diet O There is a 15% chance of a Type | error. i. Interpret the level of significance in the context of the study. There is a 5% chance that there is a difference in the population mean weight loss between those on the exercise program and those on the diet. If the population mean weight loss on the exercise program is equal to the population mean weight loss on the diet and if another 52 and 46 participants on the exercise program and on the diet are observed then there would be a 5% chance that we would end up falsely concluding that the sample mean weight loss for these 52 and 46 participants differ from each other. There is a 5% chance that you are such a beautiful person that you never have to worry about your weight. If the population mean weight loss on the exercise program is equal to the population mean weight loss on the diet and if another 52 and 46 participants on the exercise program and on the diet are observed then there would be a 5% chance that we would end up falsely concluding that the population mean weight loss on the exercise program is less than the population mean weight loss on the diet Hint: Helpful Video [+] Hints Second half of question Submit Question 3 NOVFirst half question 4 E Question 4 Do left handed starting pitchers pitch fewer innings per game on average than right handed starting pitchers? A researcher looked at nine randomly selected left handed starting pitchers' games and nine randomly selected right handed pitchers' games. The table below shows the results. Left: 6 6 6 8 7 7 7 6 Right: 7 7 7 10 9 6 8 8 Assume that both populations follow a normal distribution. What can be concluded at the the a = 0.05 level of significance level of significance? For this study, we should use |Select an answer a. The null and alternative hypotheses would be: Ho : Select an answer Select an answer v Select an answer | (please enter a decimal) H1 : Select an answer Select an answer v Select an answer | (Please enter a decimal) b. The test statistic ? v = (please show your answer to 3 decimal places.) c. The p-value = (Please show your answer to 4 decimal places.) d. The p-value is ? v a e. Based on this, we should Select an answer v | the null hypothesis. f. Thus, the final conclusion is that ... The results are statistically insignificant at a = 0.05, so there is insufficient evidence to conclude that the population mean innings per game for left handed starting pitchers is less than the population mean innings per game for right handed starting pitchers. The results are statistically significant at a = 0.05, so there is sufficient evidence to conclude that the mean innings per game for the nine left handed starting pitchers that were looked at s less than the mean innings per game for the nine right handed starting pitchers that were looked at. The results are statistically insignificant at a = 0.05, so there is statistically significant evidence to conclude that the population mean innings per game for left handed starting pitchers is equal to the population mean innings per game for right handed starting pitchers. The results are statistically significant at a = 0.05, so there is sufficient evidence to conclude that the population mean innings per game for left handed starting pitchers is less than the population mean innings per game for right handed starting pitchers. g. Interpret the p-value in the context of the study. There is a 2.72% chance of a Type | error. If the population mean innings per game for left handed starting pitchers is the same as the population mean innings per game for right handed starting pitchers and if another 8 lefties and 8 righties are observed then there would be a 2.72% chance that the mean number of innings per game for the 8 lefties would be at least 1.1 innings less than the mean innings per game for the 8 righties. If the sample mean innings per game for the 8 lefties is the same as the sample mean innings per game for the 8 righties and if another another 8 lefties and 8 righties are observed then there would be a 2.72% chance of concluding that the mean innings per game for the 8 lefties is at least 1.1 innings less than the mean innings per game for the 8 righties NOV 10 tve. Based on this, we should |Select an answer | the null hypothesis. f. Thus, the final conclusion is that ... The results are statistically insignificant at a = 0.05, so there is insufficient evidence to conclude that the population mean innings per game for left handed starting pitchers is less than the population mean innings per game for right handed starting pitchers. The results are statistically significant at a = 0.05, so there is sufficient evidence to conclude that the mean innings per game for the nine left handed starting pitchers that were looked at is less than the mean innings per game for the nine right handed starting pitchers that were looked at. The results are statistically insignificant at a = 0.05, so there is statistically significant evidence to conclude that the population mean innings per game for left handed starting pitchers is equal to the population mean innings per game for right handed starting pitchers. The results are statistically significant at a = 0.05, so there is sufficient evidence to conclude that the population mean innings per game for left handed starting pitchers is less than the population mean innings per game for right handed starting pitchers. g. Interpret the p-value in the context of the study. There is a 2.72% chance of a Type | error. If the population mean innings per game for left handed starting pitchers is the same as the population mean innings per game for right handed starting pitchers and if another 8 lefties and 8 righties are observed then there would be a 2.72% chance that the mean number of innings per game for the 8 lefties would be at least 1.1 innings less than the mean innings per game for the 8 righties. If the sample mean innings per game for the 8 lefties is the same as the sample mean innings per game for the 8 righties and if another another 8 lefties and 8 righties are observed then there would be a 2.72% chance of concluding that the mean innings per game for the 8 lefties is at least 1.1 innings less than the mean innings per game for the 8 righties There is a 2.72% chance that the mean innings per game for the 8 lefties is at least 1.1 innings less than the mean innings per game for the 8 righties. h. Interpret the level of significance in the context of the study. If the population mean innings per game for left handed starting pitchers is the same as the population mean innings per game for right handed starting pitchers and if another 8 lefties and 8 righties are observed then there would be a 5% chance that we would end up falsely concluding that the population mean innings per game for the lefties is less than the population mean innings per game for the righties There is a 5% chance that your team will win whether the starting pitcher is a lefty or a righty. What you really need is better pitchers. If the population mean innings per game for lefties is the same as the population mean innings per game for righties and if another 8 lefties and 8 righties are observed, then there would be a 5% chance that we would end up falsely concluding that the sample mean innings per game for these 8 lefties and 8 righties differ from each other. There is a 5%% chance that there is a difference in the population mean innings per game for lefties and righties. Hint: Helpful Video ) [+] Hints second half question 4 Submit Question NOV 10
Step by Step Solution
There are 3 Steps involved in it
1 Expert Approved Answer
Step: 1 Unlock
Question Has Been Solved by an Expert!
Get step-by-step solutions from verified subject matter experts
Step: 2 Unlock
Step: 3 Unlock
Students Have Also Explored These Related Mathematics Questions!