

Question: Chapter 3: In-Class Graphing (15 points) 1. Use the following data to draw supply and demand curves on the accompanying graph. Price $8 6 U
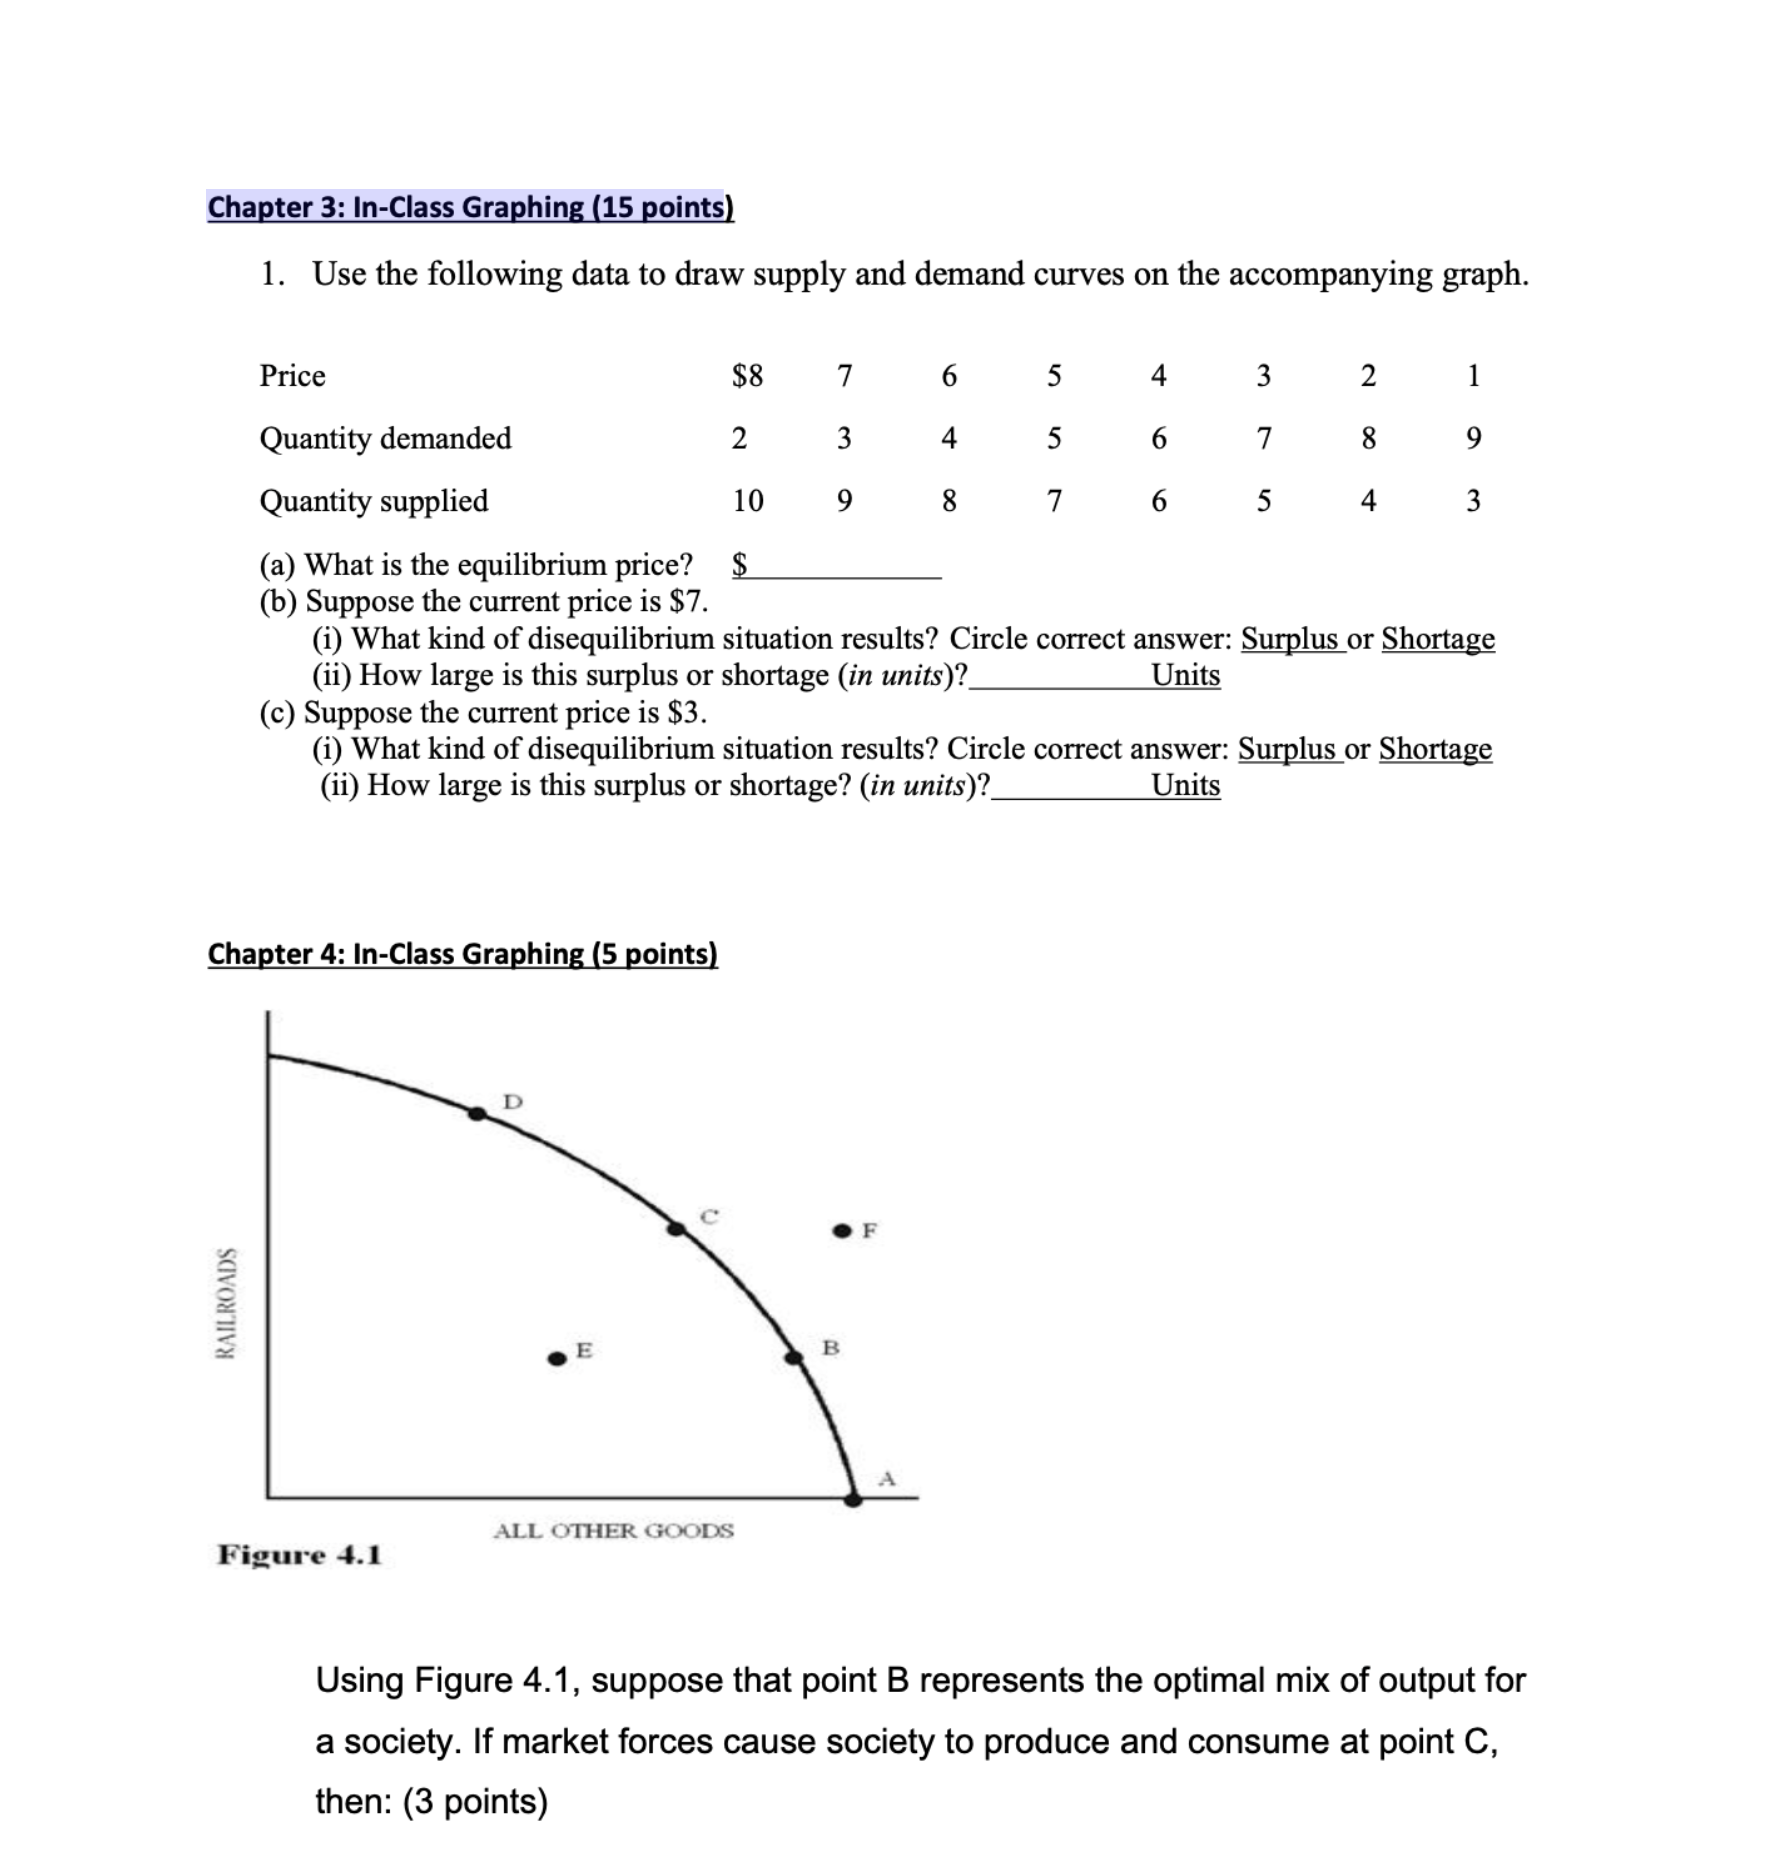
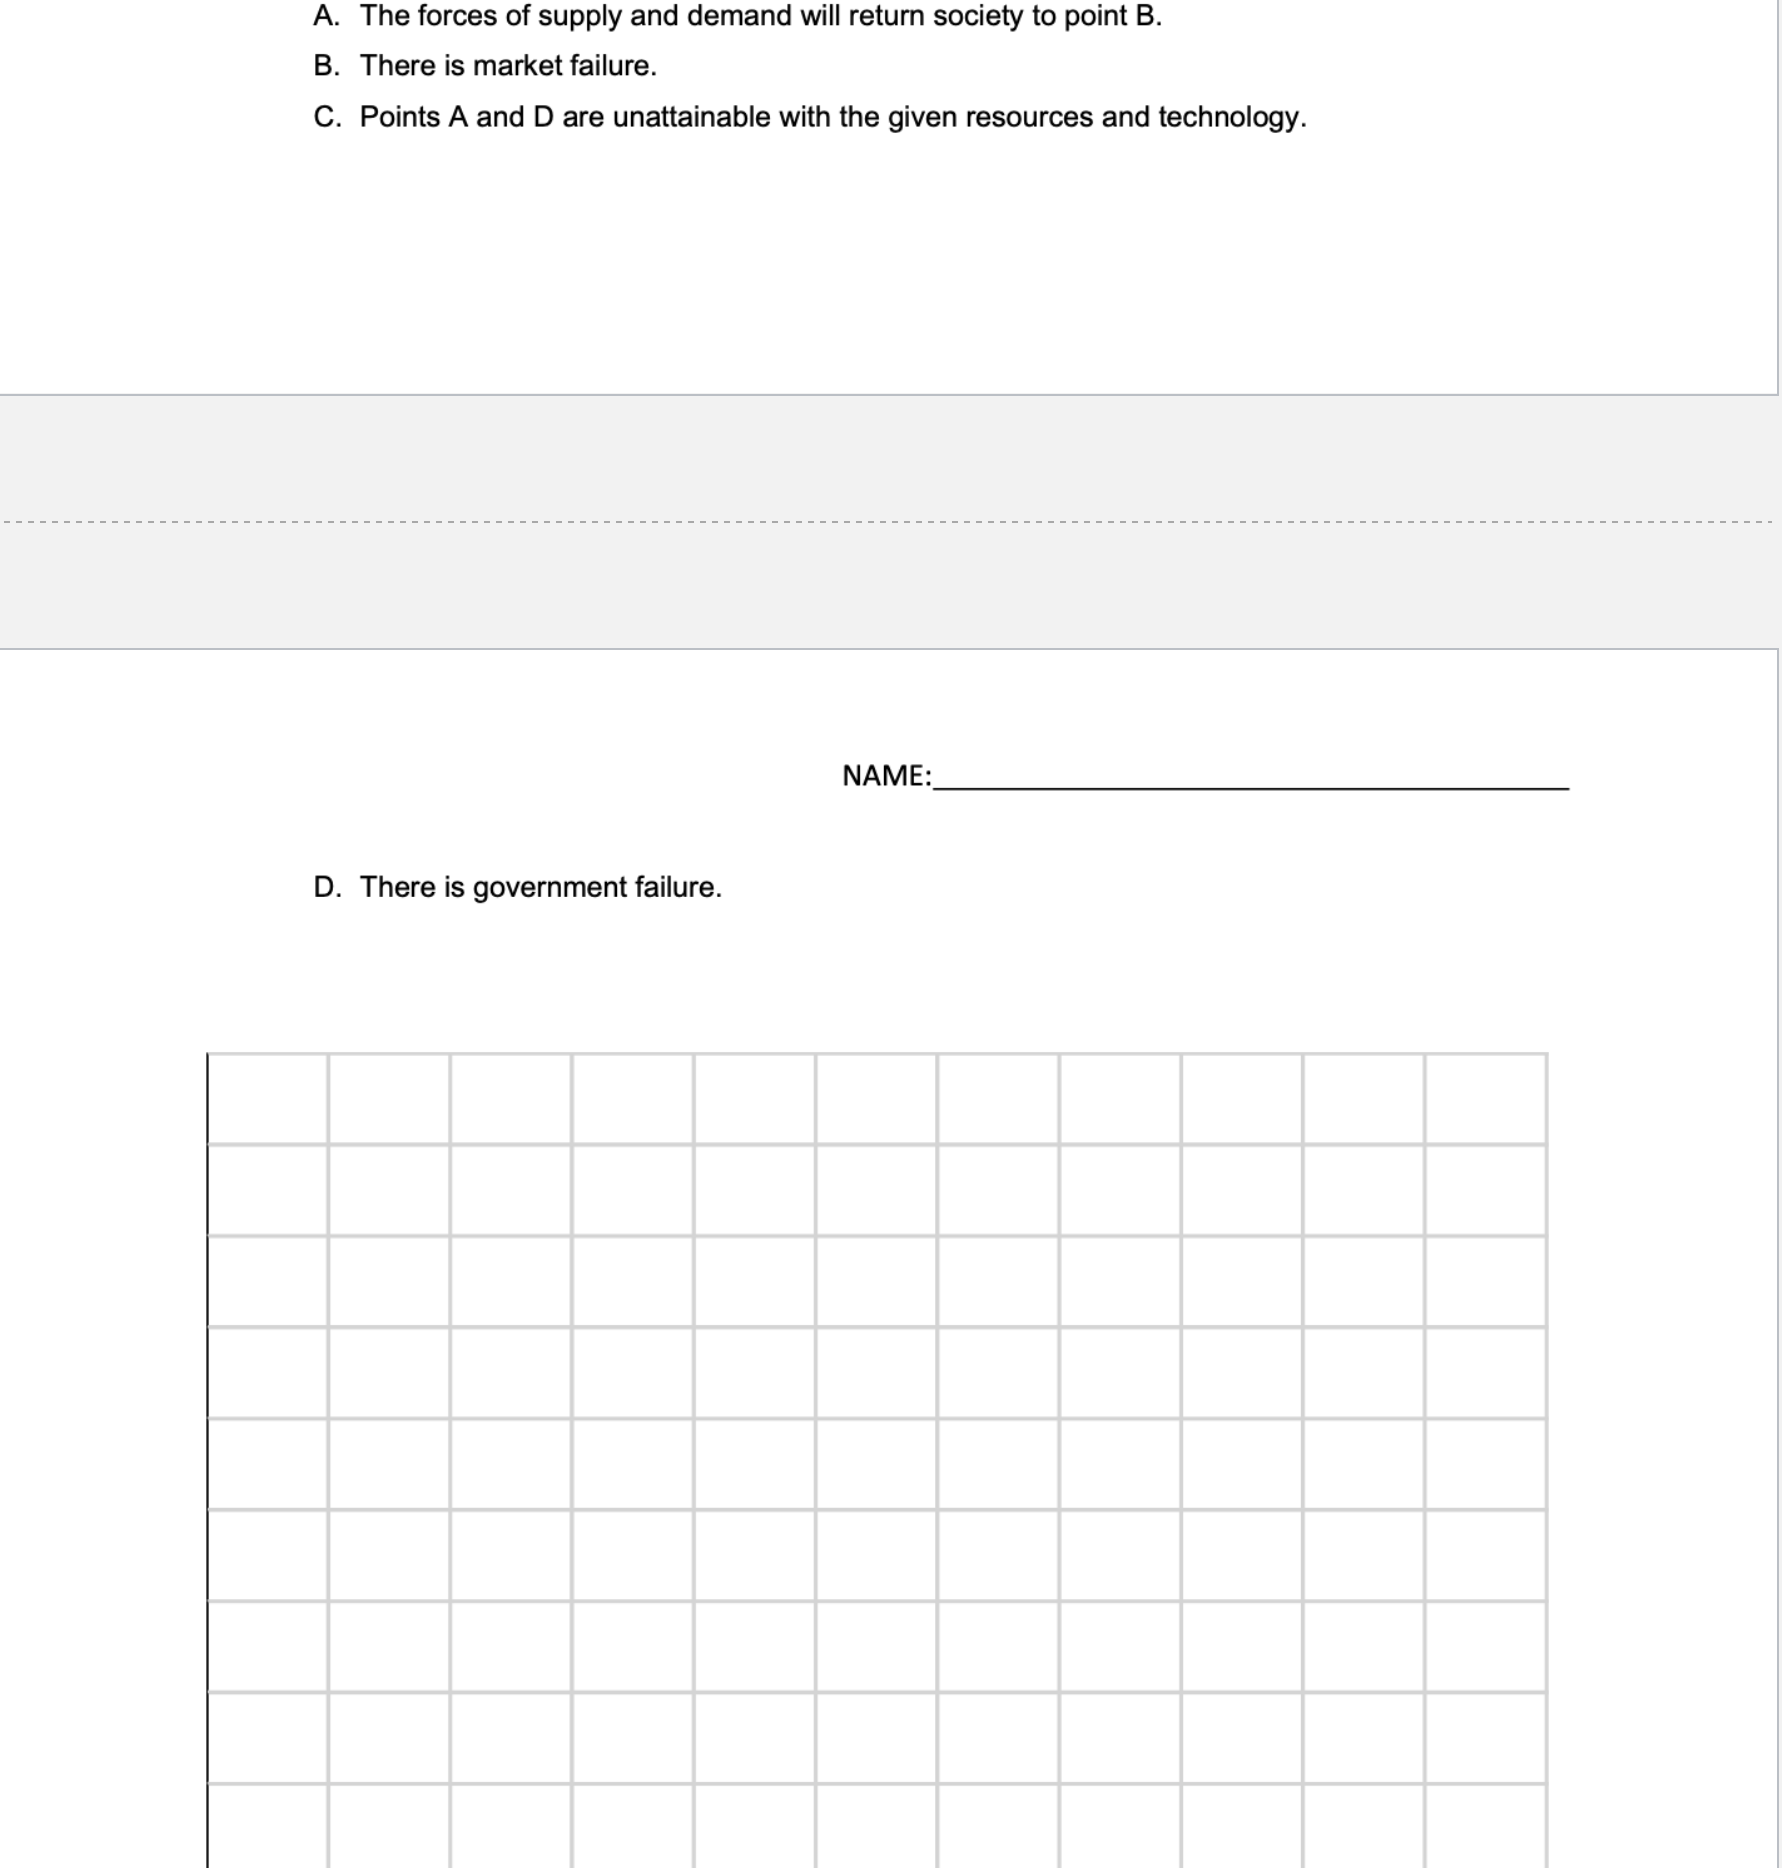
Chapter 3: In-Class Graphing (15 points) 1. Use the following data to draw supply and demand curves on the accompanying graph. Price $8 6 U 4 N Quantity demanded 4 6 J N Quantity supplied 10 O 7 5 4 w (a) What is the equilibrium price? $ (b) Suppose the current price is $7. (i) What kind of disequilibrium situation results? Circle correct answer: Surplus or Shortage (ii) How large is this surplus or shortage (in units)? Units (c) Suppose the current price is $3. (i) What kind of disequilibrium situation results? Circle correct answer: Surplus or Shortage (ii) How large is this surplus or shortage? (in units)? Units Chapter 4: In-Class Graphing (5 points) D C RAILROADS E ALL OTHER GOODS Figure 4.1 Using Figure 4.1, suppose that point B represents the optimal mix of output for a society. If market forces cause society to produce and consume at point C, then: (3 points)A. The forces of supply and demand will return society to point B. B. There is market failure. C. Points A and D are unattainable with the given resources and technology. NAME: D. There is government failure
Step by Step Solution
There are 3 Steps involved in it

Get step-by-step solutions from verified subject matter experts