

Question: QUESTION 2 Use the following data to draw supply and demand curves on the accompanying graph. Price $8 7 6 Quantity demanded 2 3 4

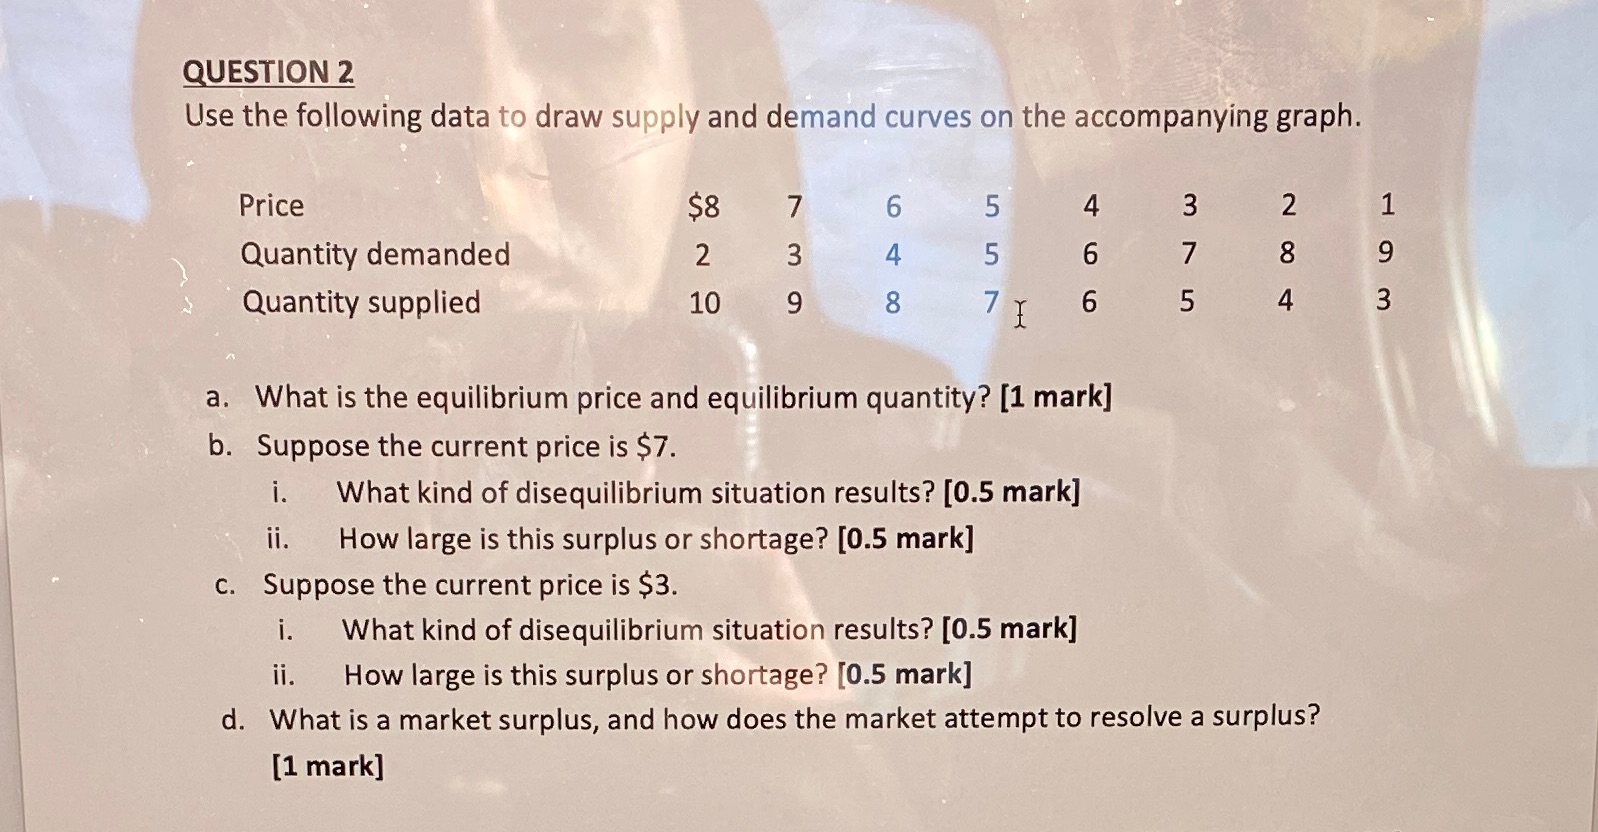
QUESTION 2 Use the following data to draw supply and demand curves on the accompanying graph. Price $8 7 6 Quantity demanded 2 3 4 5 6 V W Quantity supplied 10 9 8 6 5 WO H a. What is the equilibrium price and equilibrium quantity? [1 mark] b. Suppose the current price is $7. i. What kind of disequilibrium situation results? [0.5 mark] ii. How large is this surplus or shortage? [0.5 mark] c. Suppose the current price is $3. i. What kind of disequilibrium situation results? [0.5 mark] ii. How large is this surplus or shortage? [0.5 mark] d. What is a market surplus, and how does the market attempt to resolve a surplus? [1 mark]
Step by Step Solution
There are 3 Steps involved in it

Get step-by-step solutions from verified subject matter experts