

Question: Chapter 5: FIXED BLUR Question 1 (1 point) The table shows total consumption in an economy for two years. 2020 Price Quantity Good A $5.00
Chapter 5: FIXED BLUR
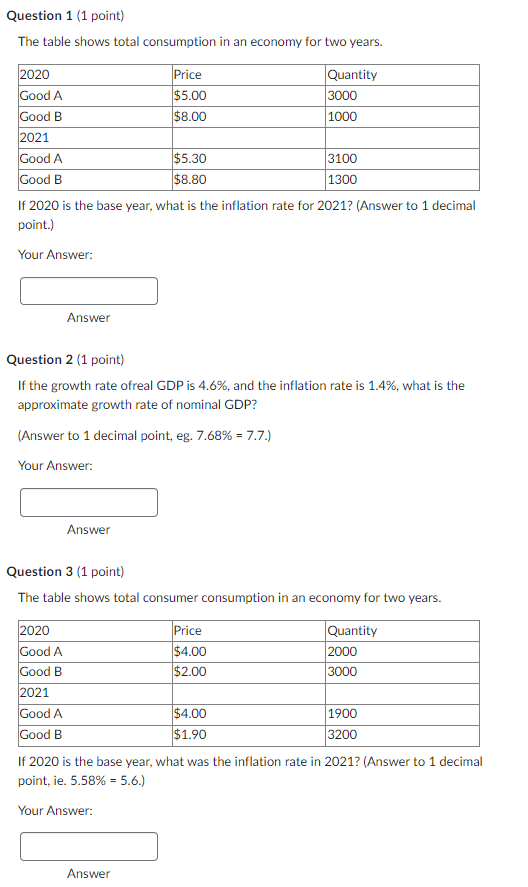
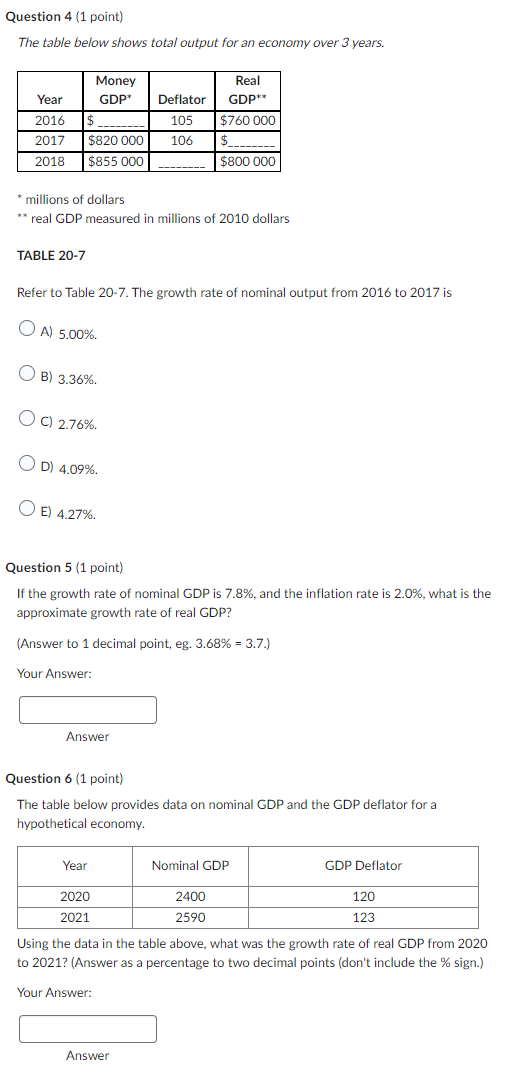
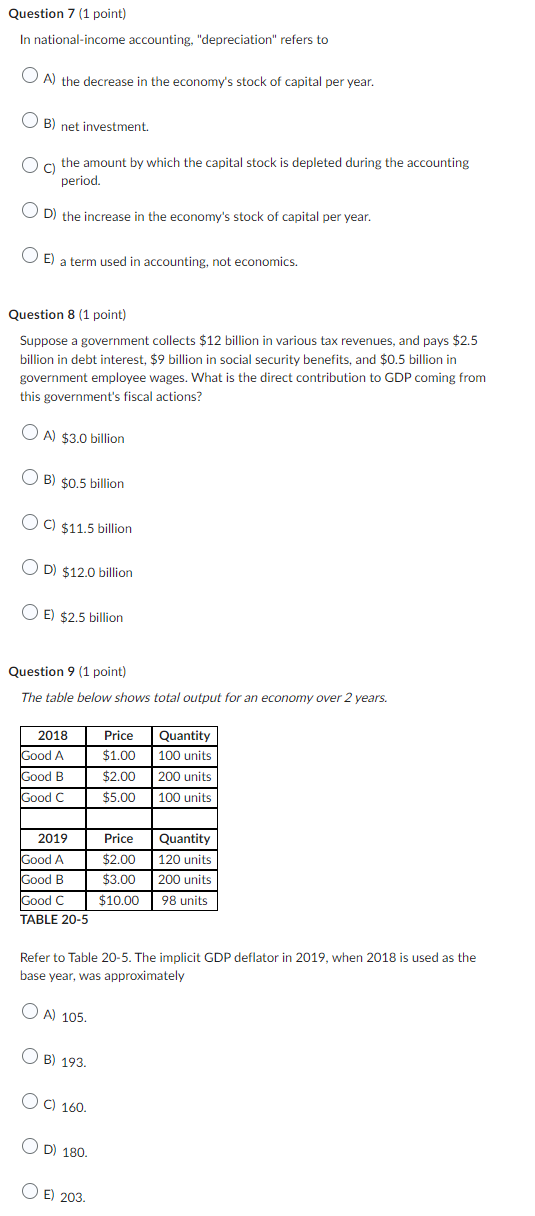
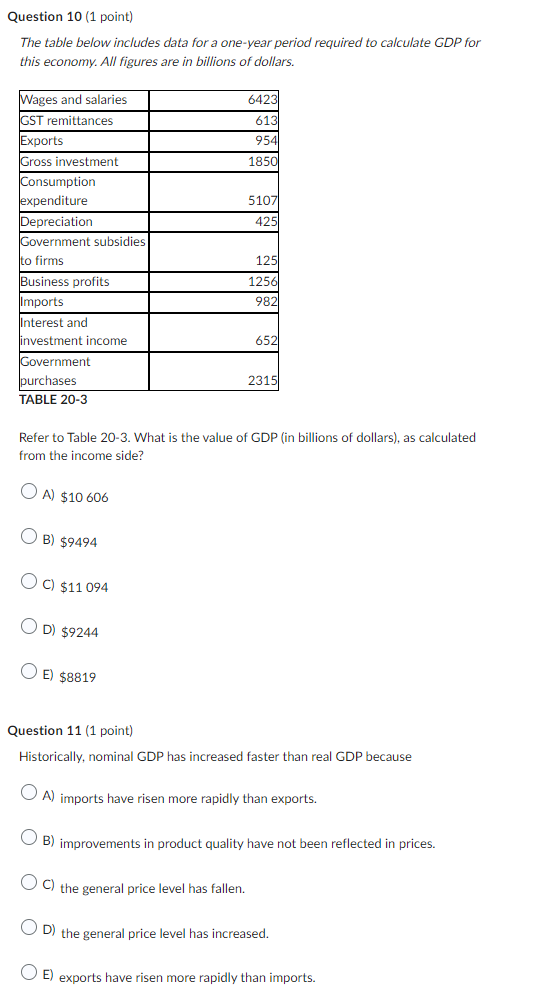
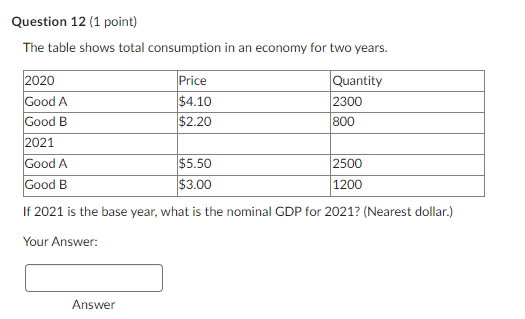
Question 1 (1 point) The table shows total consumption in an economy for two years. 2020 Price Quantity Good A $5.00 3000 Good B $8.00 1000 2021 Good A $5.30 3100 Good B $8.80 1300 If 2020 is the base year, what is the inflation rate for 2021? (Answer to 1 decimal point.) Your Answer: Answer Question 2 (1 point) If the growth rate ofreal GDP is 4.6%, and the inflation rate is 1.4%, what is the approximate growth rate of nominal GDP? (Answer to 1 decimal point, eg. 7.68% = 7.7.) Your Answer: Answer Question 3 (1 point) The table shows total consumer consumption in an economy for two years. 2020 Price Quantity Good A $4.00 2000 Good B $2.00 3000 2021 Good A $4.00 1900 Good B $1.90 3200 If 2020 is the base year, what was the inflation rate in 2021? (Answer to 1 decimal point, ie. 5.58% = 5.6.) Your Answer: AnswerQuestion 4 (1 point) The table below shows total output for an economy over 3 years. Money Real Year GDP* Deflator GDP** 2016 $ 105 $760 000 2017 $820 000 106 $ 2018 $855 000 $800 000 *millions of dollars **real GDP measured in millions of 2010 dollars TABLE 20-7 Refer to Table 20-7. The growth rate of nominal output from 2016 to 2017 is O A) 5.00%. O B) 3.36%. O C) 2.76% . O D) 4.09%. O E) 4.27%. Question 5 (1 point) If the growth rate of nominal GDP is 7.8%, and the inflation rate is 2.0%, what is the approximate growth rate of real GDP? (Answer to 1 decimal point, eg. 3.68% = 3.7.) Your Answer: Answer Question 6 (1 point) The table below provides data on nominal GDP and the GDP deflator for a hypothetical economy. Year Nominal GDP GDP Deflator 2020 2400 120 2021 2590 123 Using the data in the table above, what was the growth rate of real GDP from 2020 to 2021? (Answer as a percentage to two decimal points (don't include the % sign.) Your Answer: AnswerQuestion 7 (1 point) In national-income accounting, "depreciation" refers to O A) the decrease in the economy's stock of capital per year. O B) net investment. O c) the amount by which the capital stock is depleted during the accounting period. O D) the increase in the economy's stock of capital per year. O E) a term used in accounting, not economics. Question 8 (1 point) Suppose a government collects $12 billion in various tax revenues, and pays $2.5 billion in debt interest, $9 billion in social security benefits, and $0.5 billion in government employee wages. What is the direct contribution to GDP coming from this government's fiscal actions? O A) $3.0 billion O B) $0.5 billion O C) $11.5 billion O D) $12.0 billion O E) $2.5 billion Question 9 (1 point) The table below shows total output for an economy over 2 years. 2018 Price Quantity Good A $1.00 100 units Good B $2.00 200 units Good C $5.00 100 units 2019 Price Quantity Good A $2.00 120 units Good B $3.00 200 units Good C $10.00 98 units TABLE 20-5 Refer to Table 20-5. The implicit GDP deflator in 2019, when 2018 is used as the base year, was approximately O A) 105. B) 193. O C) 160. OD) 180. O E) 203.Question 10 (1 point) The table below includes data for a one-year period required to calculate GDP for this economy. All figures are in billions of dollars. Wages and salaries 6423 GST remittances 613 Exports 954 Gross investment 1850 Consumption expenditure 5107 Depreciation 425 Government subsidies to firms 125 Business profits 1256 Imports 982 Interest and investment income 652 Government purchases 2315 TABLE 20-3 Refer to Table 20-3. What is the value of GDP (in billions of dollars), as calculated from the income side? O A) $10 606 O B) $9494 O C) $11 094 O D) $9244 O E) $8819 Question 11 (1 point) Historically, nominal GDP has increased faster than real GDP because O A) imports have risen more rapidly than exports. B) improvements in product quality have not been reflected in prices. O C) the general price level has fallen. O D) the general price level has increased. O E) exports have risen more rapidly than imports.Question 12 (1 point) The table shows total consumption in an economy for two years. 2020 Price Quantity Good A $4.10 2300 Good B $2.20 800 2021 Good A $5.50 2500 Good B $3.00 1200 If 2021 is the base year, what is the nominal GDP for 2021? (Nearest dollar.) Your
Step by Step Solution
There are 3 Steps involved in it

Get step-by-step solutions from verified subject matter experts