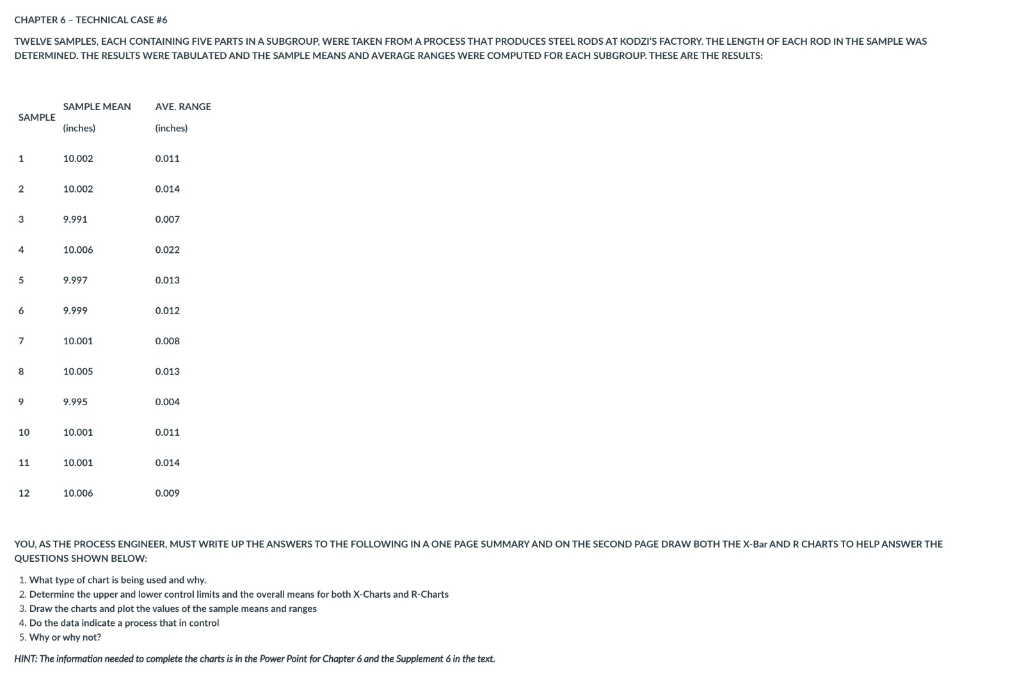
Question: CHAPTER 6 - TECHNICAL CASE #6 TWELVE SAMPLES, EACH CONTAINING FIVE PARTS IN A SUBGROUP, WERE TAKEN FROM A PROCESS THAT PRODUCES STEEL RODS AT

CHAPTER 6 - TECHNICAL CASE #6 TWELVE SAMPLES,

CHAPTER 6 - TECHNICAL CASE #6 TWELVE SAMPLES, EACH CONTAINING FIVE PARTS IN A SUBGROUP, WERE TAKEN FROM A PROCESS THAT PRODUCES STEEL RODS AT KODZI'S FACTORY. THE LENGTH OF EACH ROD IN THE SAMPLE WAS DETERMINED. THE RESULTS WERE TABULATED AND THE SAMPLE MEANS AND AVERAGE RANGES WERE COMPUTED FOR EACH SUBGROUP. THESE ARE THE RESULTS: SAMPLE MEAN AVE. RANGE SAMPLE (inches) (inches) 1 10.002 0.011 2 10.002 0.014 3 3 9.991 0.007 4 10.006 0.022 5 9.997 0.013 6 9.999 0.012 7 10.001 0.008 8 10.005 0.013 9 9.995 0.004 10 10.001 0.011 11 10.001 0.014 12 10.006 0.009 YOU, AS THE PROCESS ENGINEER, MUST WRITE UP THE ANSWERS TO THE FOLLOWING IN A ONE PAGE SUMMARY AND ON THE SECOND PAGE DRAW BOTH THE X-Bar ANDR CHARTS TO HELP ANSWER THE A QUESTIONS SHOWN BELOW: 1. What type of chart is being used and why. 2. Determine the upper and lower control limits and the overall means for both X-Charts and R-Charts 3. Draw the charts and plot the values of the sample means and ranges 4. Do the data indicate a process that in control 5. Why or why not? HINT: The information needed to complete the charts is in the Power Point for Chapter 6 and the Supplement 6 in the text

Step by Step Solution

There are 3 Steps involved in it

1 Expert Approved Answer
Step: 1 Unlock blur-text-image
Question Has Been Solved by an Expert!

Get step-by-step solutions from verified subject matter experts

Step: 2 Unlock
Step: 3 Unlock

Students Have Also Explored These Related General Management Questions!