

Question: CHART IS INCLUDED!! PLEASE SHOW WORK FOR THE AGE ADJUSTED PART! Calculate the age-adjusted mortality rate for both counties, using the US 2000 standard population.
CHART IS INCLUDED!! PLEASE SHOW WORK FOR THE AGE ADJUSTED PART!
Calculate the age-adjusted mortality rate for both counties, using the US 2000 standard population. Use the direct adjustment method that utilizes calculating the expected number of deaths for each age group as the method for calculating the age-adjusted mortality rate. Fill in the empty columns in the table as part of showing your work, then report here the age-adjusted mortality rate for each county as deaths per 1,000. (4 points)
Buncombe county age-adjusted mortality rate = Pitt county age-adjusted mortality rate =
3. What can you conclude about the mortality rates between Buncombe County and Pitt county?
4. was it important to perform age-adjustment before comparing these two counties? Why or why not?
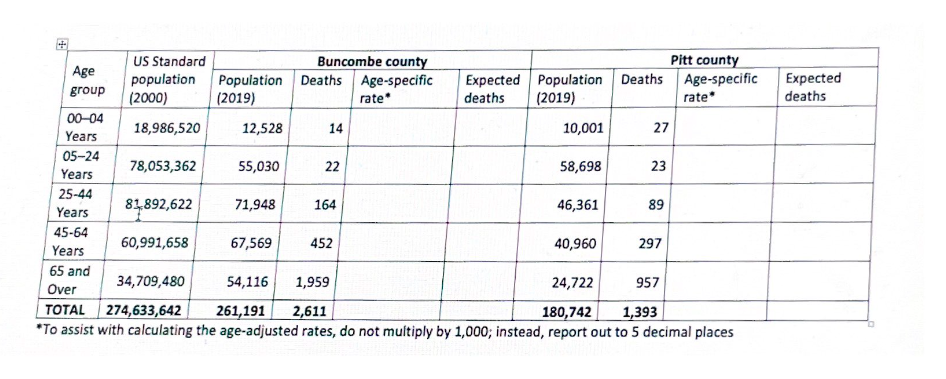
"To assist with calculating the age-adjusted rates, do not multiply by 1,000 ; instead, report out to 5 decimal places
Step by Step Solution
There are 3 Steps involved in it

Get step-by-step solutions from verified subject matter experts