

Question: Chart with answer has been provided - please find the observed value statistic as shown in last picture. Create a new variable called Index such
Chart with answer has been provided - please find the observed value statistic as shown in last picture.
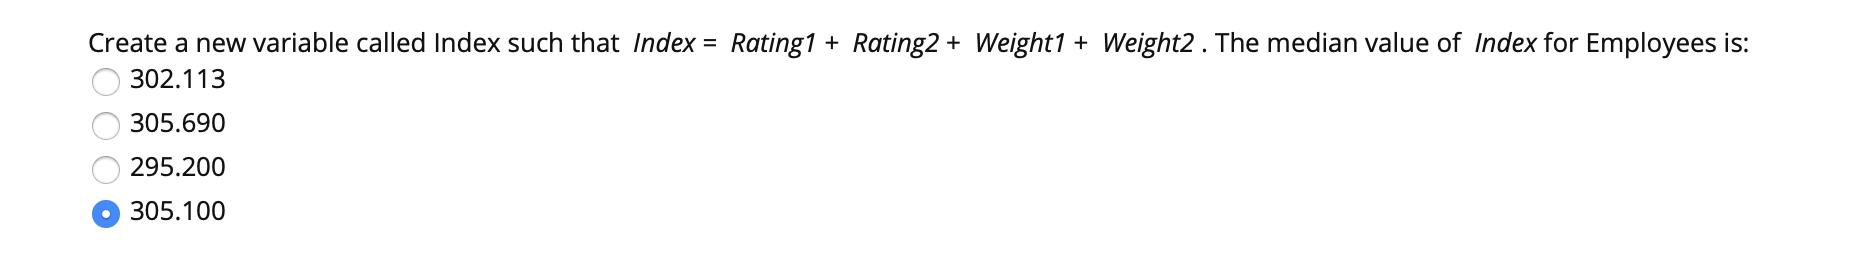
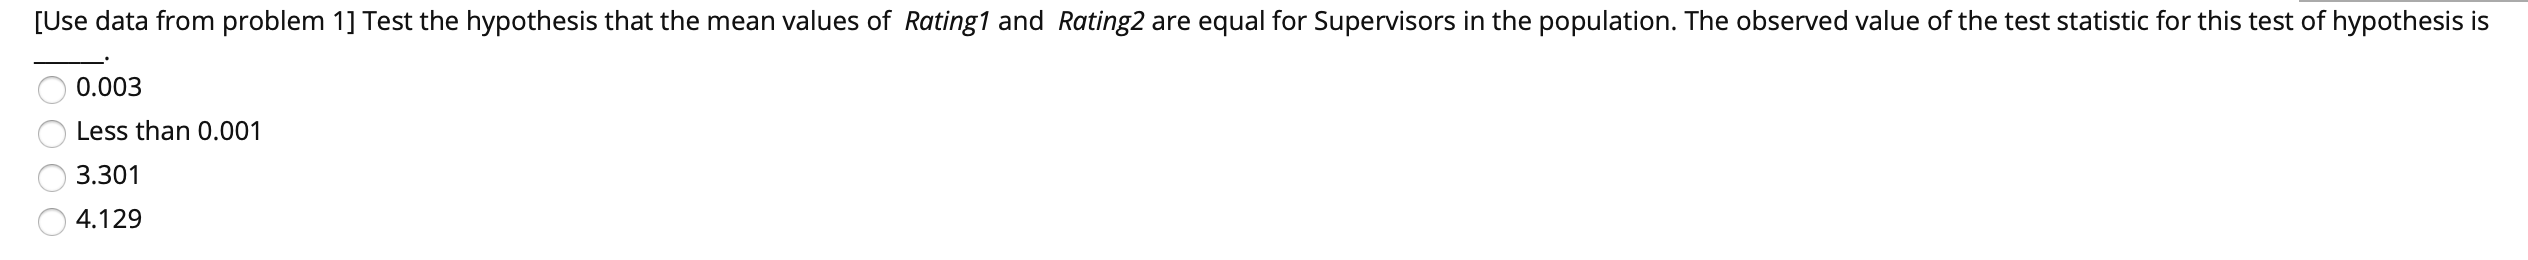
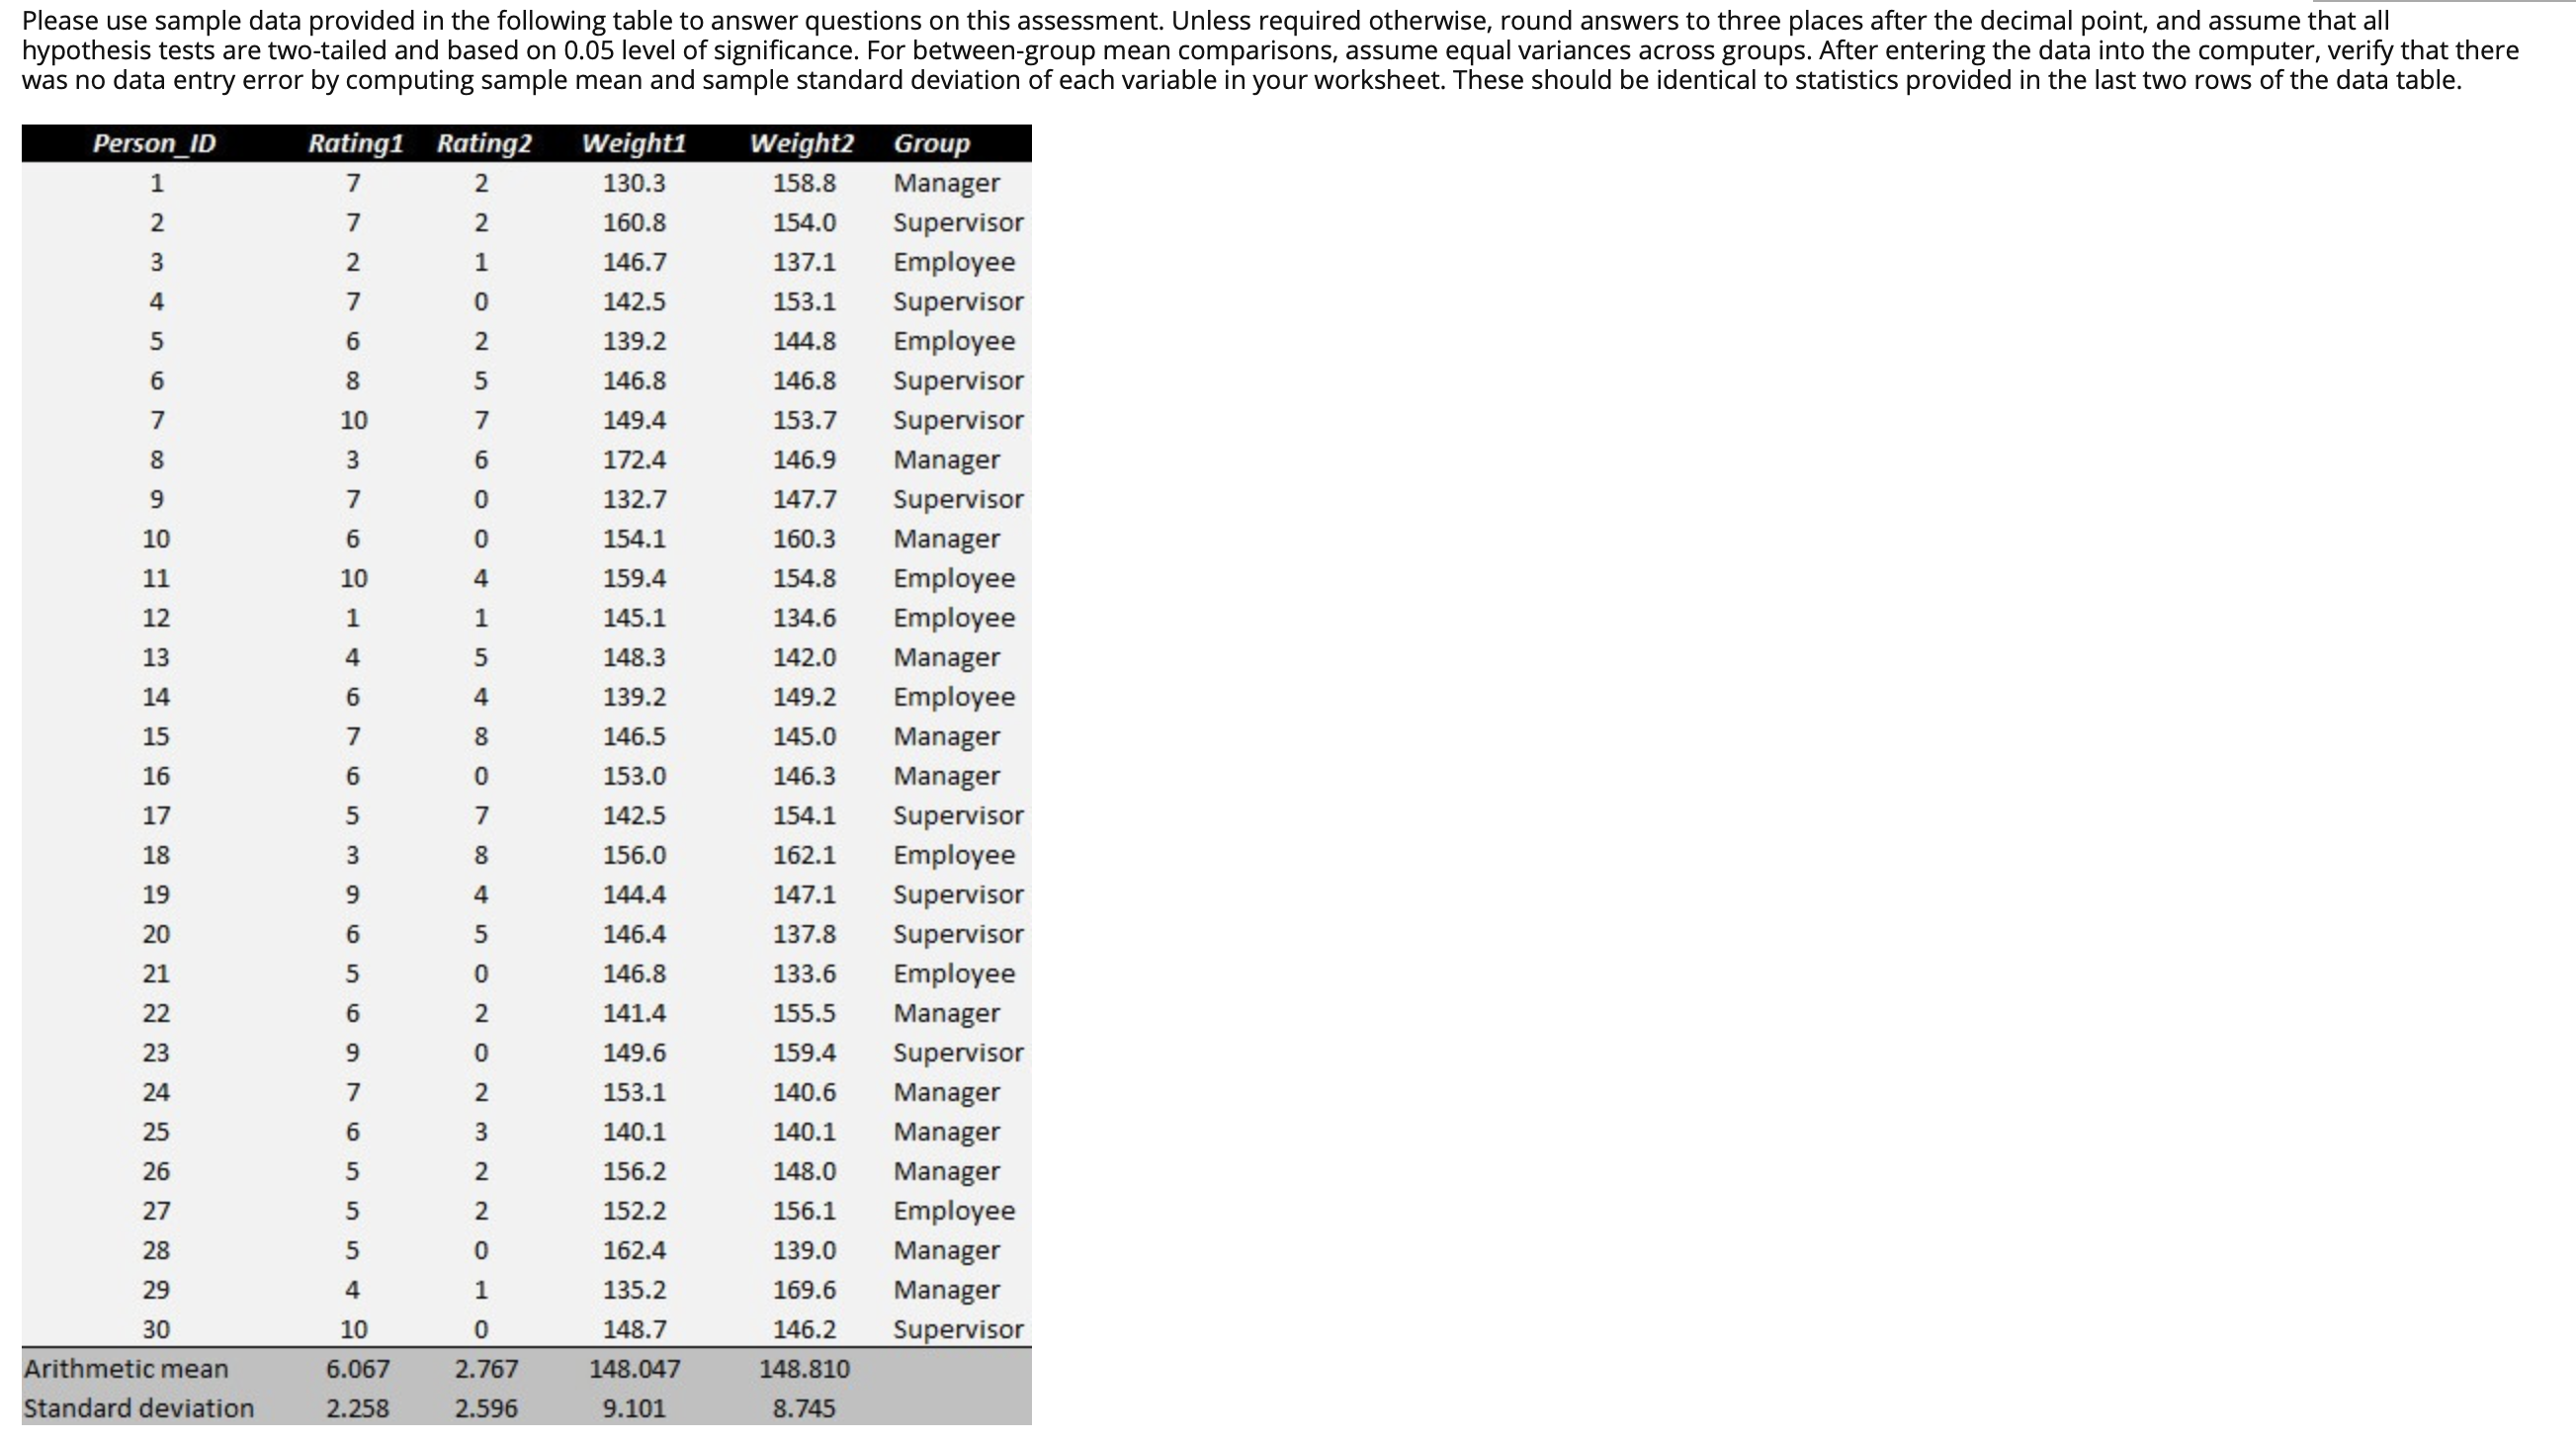
Create a new variable called Index such that Index = Rating1 + Rating2 + Weight1 + Weight2 . The median value of Index for Employees is: 302.113 305.690 O 295.200 O 305.100[Use data from problem 1] Test the hypothesis that the mean values of Rating1 and Rating2 are equal for Supervisors in the population. The observed value of the test statistic for this test of hypothesis is O 0.003 Less than 0.001 3.301 4.129Please use sample data provided in the following table to answer questions on this assessment. Unless required othenNise, round answers to three places after the decimal point, and assume that all hypothesis tests are two-tailed and based on 0.05 level of signicance. For between-group mean comparisons, assume equal variances across groups. After entering the data into the computer, verify that there was no data entry error by computing sample mean and sample standard deviation of each variable in yourworksheet. These should be identical to statistics provided in the last two rows of the data table. Rummy] Rutu] Well/lit] - (mm)! 1 7 2 130.3 Manager 2 7 2 160.8 Supervisor 3 2 1 146.7 137.1 Employee 4 7 0 142.5 153.1 Supervisor 5 6 2 139.2 144.8 Employee 6 8 5 146.8 146.8 Supervisor 7 10 7 149.4 153.7 Supervisor 8 3 6 172.4 146.9 Manager 9 7 0 132.7 147.7 Supervisor 10 6 0 154.1 160.3 Manager 11 1o 4 159.4 154.8 Employee 12 1 1 145.1 134.6 Employee 13 4 5 148.3 142.0 Manager 14 s 4 139.2 149.2 Employee 15 7 8 146.5 145.0 Manager 16 6 0 153.0 146.3 Manager 17 5 7 142.5 154.1 Supervisor 18 3 8 15cm 162.1 Employee 19 9 4 144.4 147.1 Supervisor 20 6 5 146.4 137.8 Supervisor 21 s 0 ms 133.6 Employee 22 6 2 141.4 155.5 Manager 23 9 0 149.6 159.4 Supervisor 24 7 2 153.1 140.6 Manager 25 6 3 140.1 140.1 Manager 26 5 2 156.2 148.0 Manager 27 5 2 152,2 156.1 Employee 28 5 0 162.4 139.0 Manager 29 4 1 135.2 169.6 Manager 30 10 0 148.7 146.2 Suirvisor
Step by Step Solution
There are 3 Steps involved in it

Get step-by-step solutions from verified subject matter experts