

Question: Chase Plan: Level Utilization: Mixed Plan: Create: One aggregate plan (Sales and Operations Plan) using the chase strategy. One aggregate plan (Sales and Operations Plan)
Chase Plan:
Level Utilization:
Mixed Plan:
Create:
One aggregate plan (Sales and Operations Plan) using the chase strategy.
One aggregate plan (Sales and Operations Plan) using the level-utilization strategy.
One optimized aggregate plan (Sales and Operations Plan) using a mixed strategy.
An Executive Summary explaining your mixed plan in the context of the other two plans.
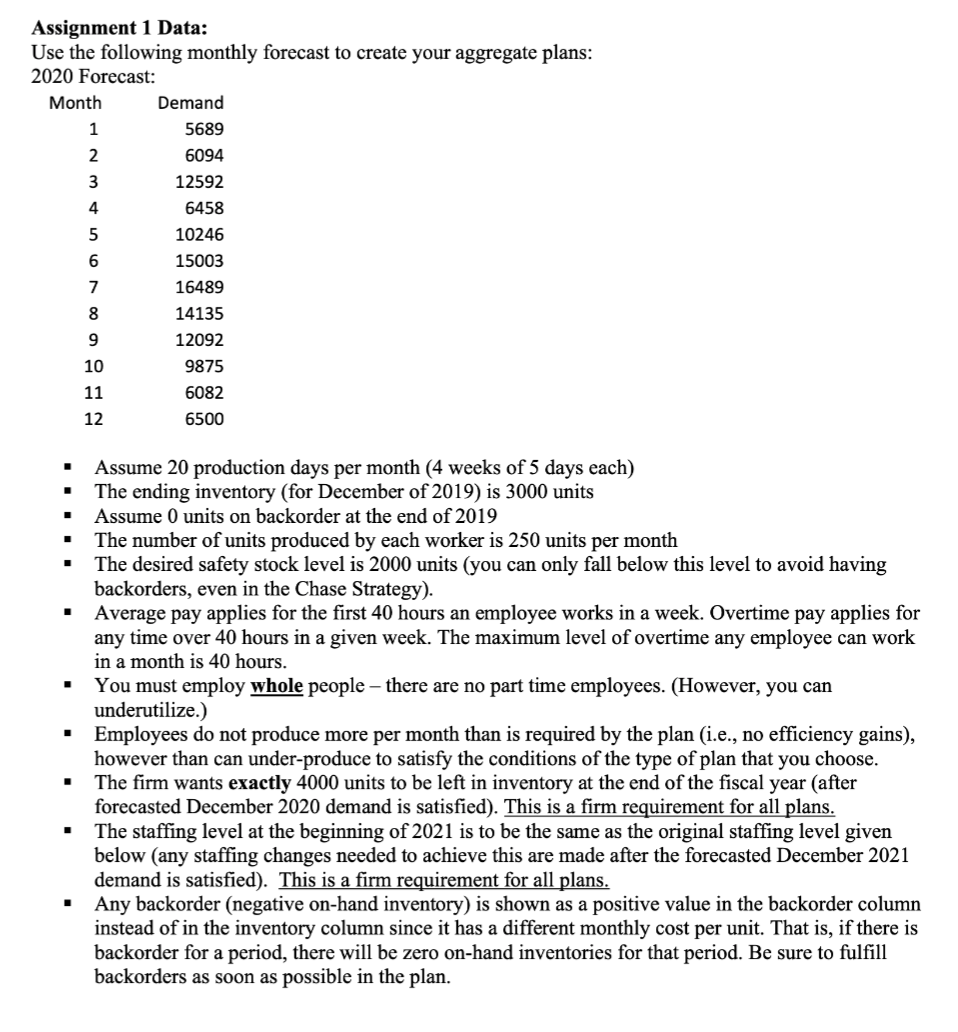
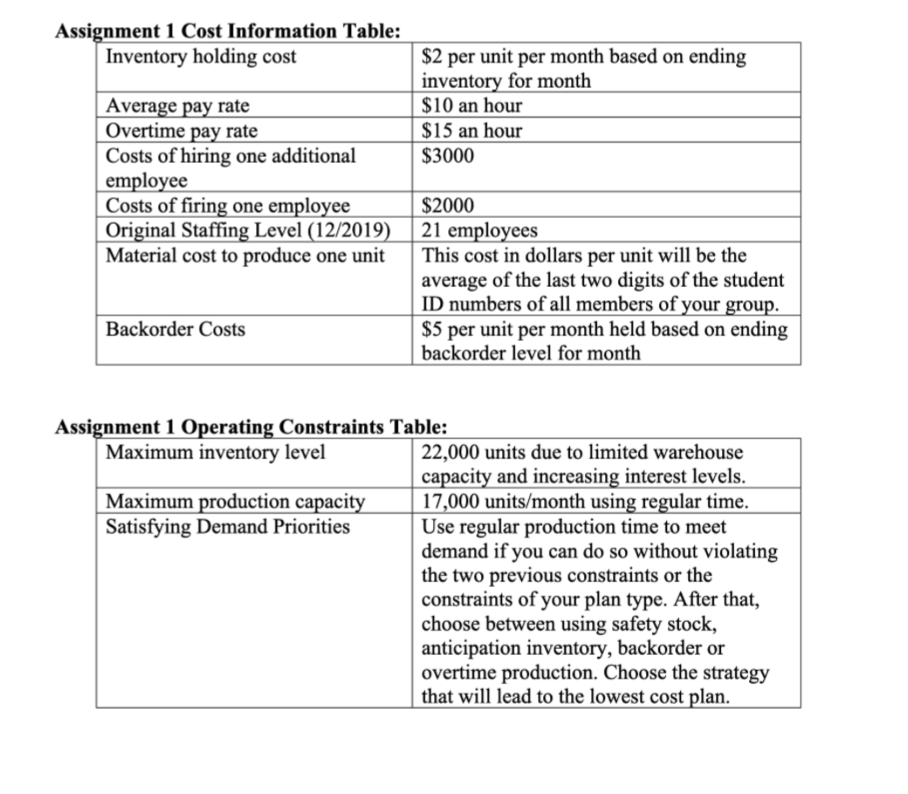
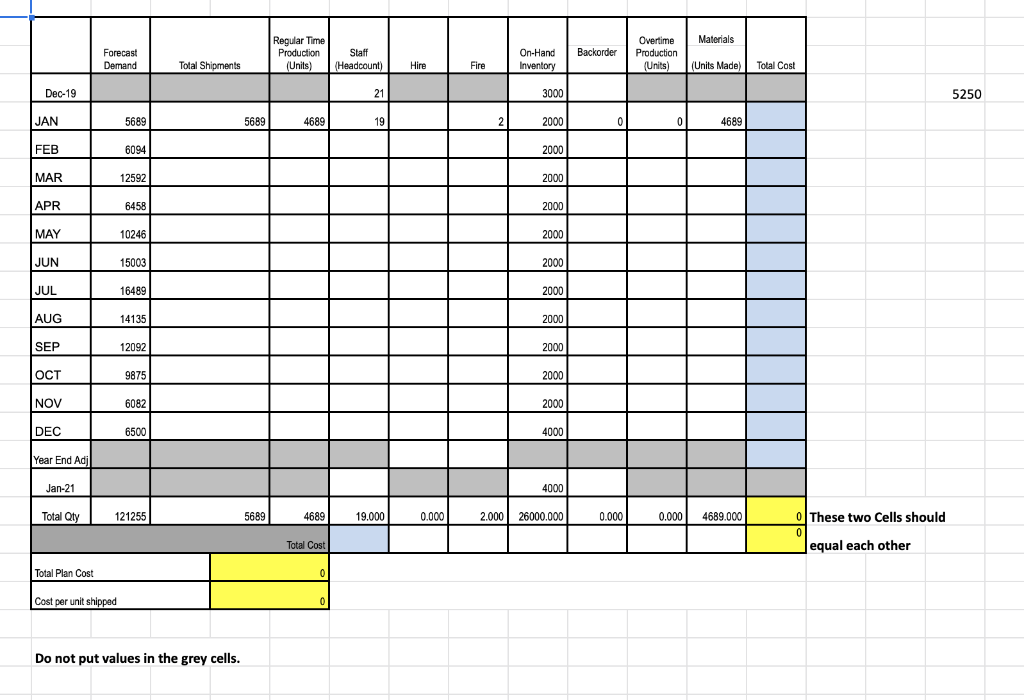
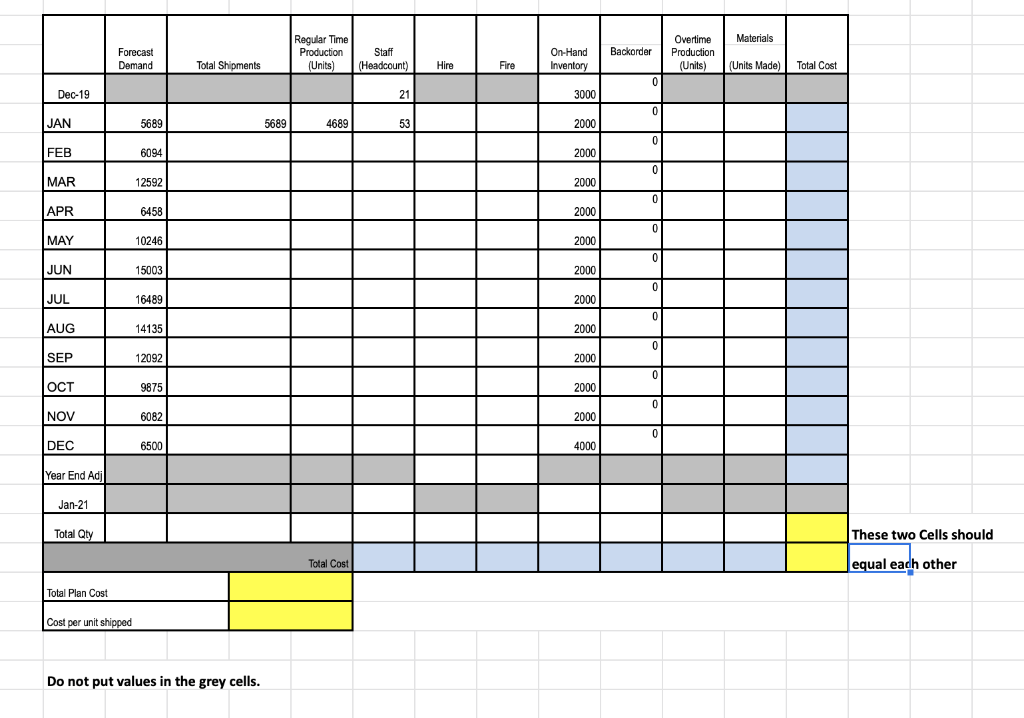
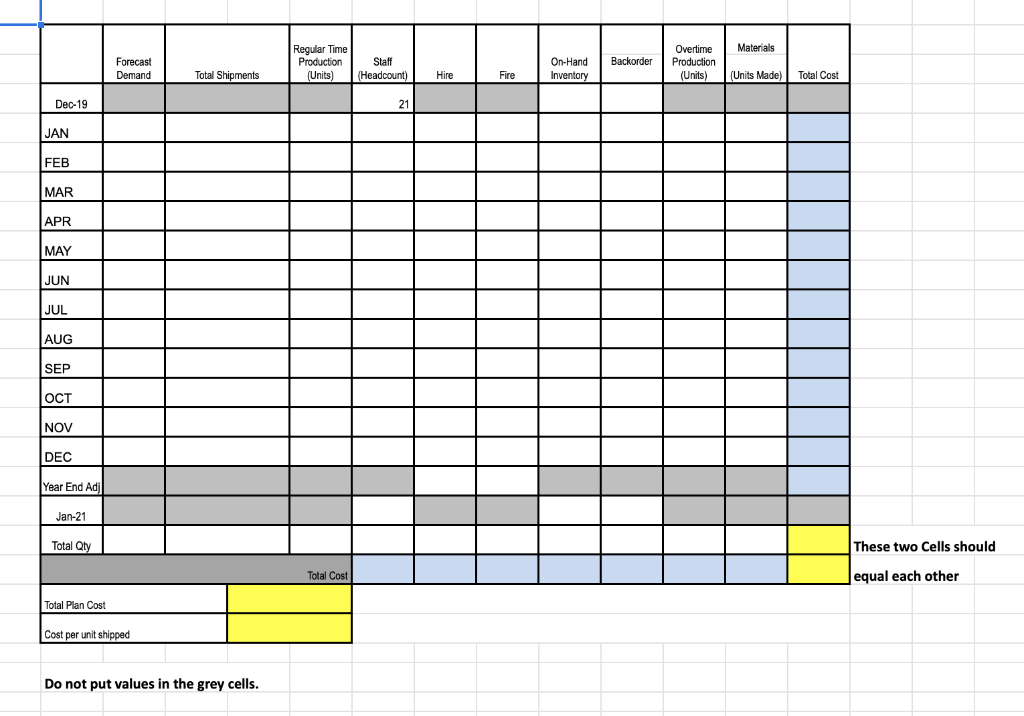
Assignment 1 Data: Use the following monthly forecast to create your aggregate plans: 2020 Forecast: Month Demand 1 5689 2 6094 3 4 5 6 12592 6458 10246 15003 16489 14135 12092 9875 7 8 9 10 11 6082 6500 12 . 1 1 . . - Assume 20 production days per month (4 weeks of 5 days each) The ending inventory (for December of 2019) is 3000 units Assume 0 units on backorder at the end of 2019 The number of units produced by each worker is 250 units per month The desired safety stock level is 2000 units (you can only fall below this level to avoid having backorders, even in the Chase Strategy). Average pay applies for the first 40 hours an employee works in a week. Overtime pay applies for any time over 40 hours in a given week. The maximum level of overtime any employee can work in a month is 40 hours. You must employ whole people there are no part time employees. (However, you can underutilize.) Employees do not produce more per month than is required by the plan (i.e., no efficiency gains), however than can under-produce to satisfy the conditions of the type of plan that you choose. The firm wants exactly 4000 units to be left in inventory at the end of the fiscal year (after forecasted December 2020 demand is satisfied). This is a firm requirement for all plans. The staffing level at the beginning of 2021 is to be the same as the original staffing level given below (any staffing changes needed to achieve this are made after the forecasted December 2021 demand is satisfied). This is a firm requirement for all plans. Any backorder (negative on-hand inventory) is shown as a positive value in the backorder column instead of in the inventory column since it has a different monthly cost per unit. That is, if there is backorder for a period, there will be zero on-hand inventories for that period. Be sure to fulfill backorders as soon as possible in the plan. Assignment 1 Cost Information Table: Inventory holding cost $2 per unit per month based on ending inventory for month Average pay rate $10 an hour Overtime pay rate $15 an hour Costs of hiring one additional $3000 employee Costs of firing one employee $2000 Original Staffing Level (12/2019) 21 employees Material cost to produce one unit This cost in dollars per unit will be the average of the last two digits of the student ID numbers of all members of your group. Backorder Costs $5 per unit per month held based on ending backorder level for month Assignment 1 Operating Constraints Table: Maximum inventory level 22,000 units due to limited warehouse capacity and increasing interest levels. Maximum production capacity 17,000 units/month using regular time. Satisfying Demand Priorities Use regular production time to meet demand if you can do so without violating the two previous constraints or the constraints of your plan type. After that, choose between using safety stock, anticipation inventory, backorder or overtime production. Choose the strategy that will lead to the lowest cost plan. Materials Regular Time Production (Units) Forecast Demand Backorder Staff (Headcount) On-Hand Inventory Overtime Production (Units) Total Shipments Hire Fire (Units Made) Total Cost Dec-19 21 3000 5250 JAN 5689 5689 4689 19 2 2000 0 0 4689 FEB 6094 2000 MAR 12592 2000 APR 6458 2000 MAY 10246 2000 JUN 15003 2000 JUL 16489 2000 AUG 14135 2000 SEP 12092 2000 OCT 9875 2000 NOV 6082 2000 DEC 6500 4000 Year End Adj Jan-21 40001 Total Qty 121255 5689 4689 19.000 0.000 2.000 26000.000 0.000 0.000 4689.000 O These two Cells should 0 equal each other Total Cost Total Plan Cost 0 Cost per unit shipped 0 Do not put values in the grey cells. Materials Forecast Demand Regular Time Production Staff (Units) (Headcount) Backorder On-Hand Inventory Overtime Production (Units) Total Shipments Hire Fire (Units Made) Total Cost 0 0 Dec-19 21 3000 0 JAN 5689 5689 4689 53 2000 0 0 FEB 6094 2000 0 MAR 12592 2000 0 0 APR 6458 2000 0 MAY 10246 2000 0 JUN 15003 2000 0 JUL 16489 2000 0 0 AUG 14135 2000 0 SEP 12092 2000 0 OCT 9875 2000 0 NOV 6082 2000 0 0 DEC 6500 4000 Year End Adi Jan-21 Total Qty These two Cells should Total Cost equal each other Total Plan Cost Cost per unit shipped Do not put values in the grey cells. Materials Regular Time Production (Units) Forecast Demand Backorder Staff (Headcount) Total Shipments Overtime Production (Units) On-Hand Inventory Hire Fire (Units Made) Total Cost Dec-19 21 JAN FEB MAR APR MAY JUN JUL AUG SEP OCT NOV DEC Year End Adi - Jan-21 Total Qty These two Cells should Total Cost equal each other Total Plan Cost Cost per unit shipped Do not put values in the grey cells
Step by Step Solution
There are 3 Steps involved in it
1 Expert Approved Answer
Step: 1 Unlock

Question Has Been Solved by an Expert!
Get step-by-step solutions from verified subject matter experts
Step: 2 Unlock
Step: 3 Unlock