

Question: choose the correct answer. The given graph shows the temperature T in F at a city between 5AM. and 8 PM. [o] Which of the
choose the correct answer.
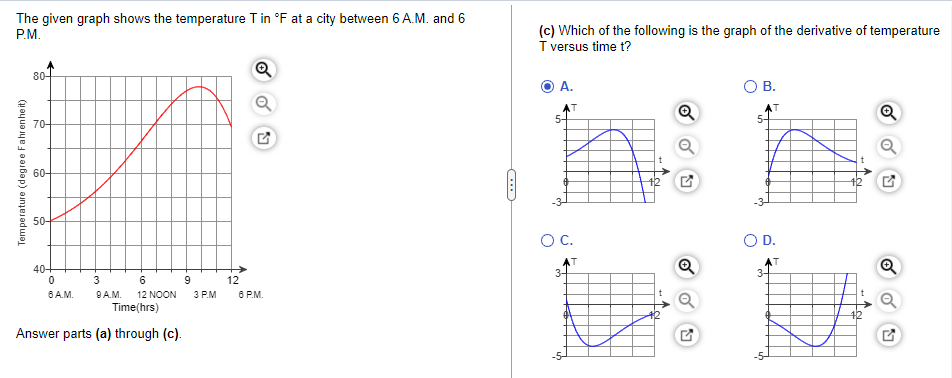
The given graph shows the temperature T in F at a city between 5AM. and 8 PM. [o] Which of the following is the graph of the derivative of temperature T versus time I? Q A. O B. 9 EL a T a E E u; a a e t t E { " :4 " :4 E r! O C. O D. 3..I.T Q T Q I] 3 E 9 12 EA". 99.11. 12 NOON 3PM -FM. t t Tlme{hrs} 9' 9' Answer parts (a: through [c]. [3 [3 .5
Step by Step Solution
There are 3 Steps involved in it
1 Expert Approved Answer
Step: 1 Unlock

Question Has Been Solved by an Expert!
Get step-by-step solutions from verified subject matter experts
Step: 2 Unlock
Step: 3 Unlock