

Question: CLC - Financial Statement Analysis Report: Profitability Analysis Part 1: Profitability Ratios of Amazon In the Ratios tab of the FSAR Excel Spreadsheet, complete the
CLC - Financial Statement Analysis Report: Profitability Analysis
Part 1: Profitability Ratios of Amazon
In the Ratios tab of the FSAR Excel Spreadsheet, complete the Profitability Ratios section. Calculate the profitability ratios. Address the following analysis questions in the comments section of each ratio:
What accounts changed for the period and how did this affect the Financial Analysis calculation?
Why did the account change during the period? Explain what business decisions may have caused the change.
How does this change influence the company's performance?
Please Help!
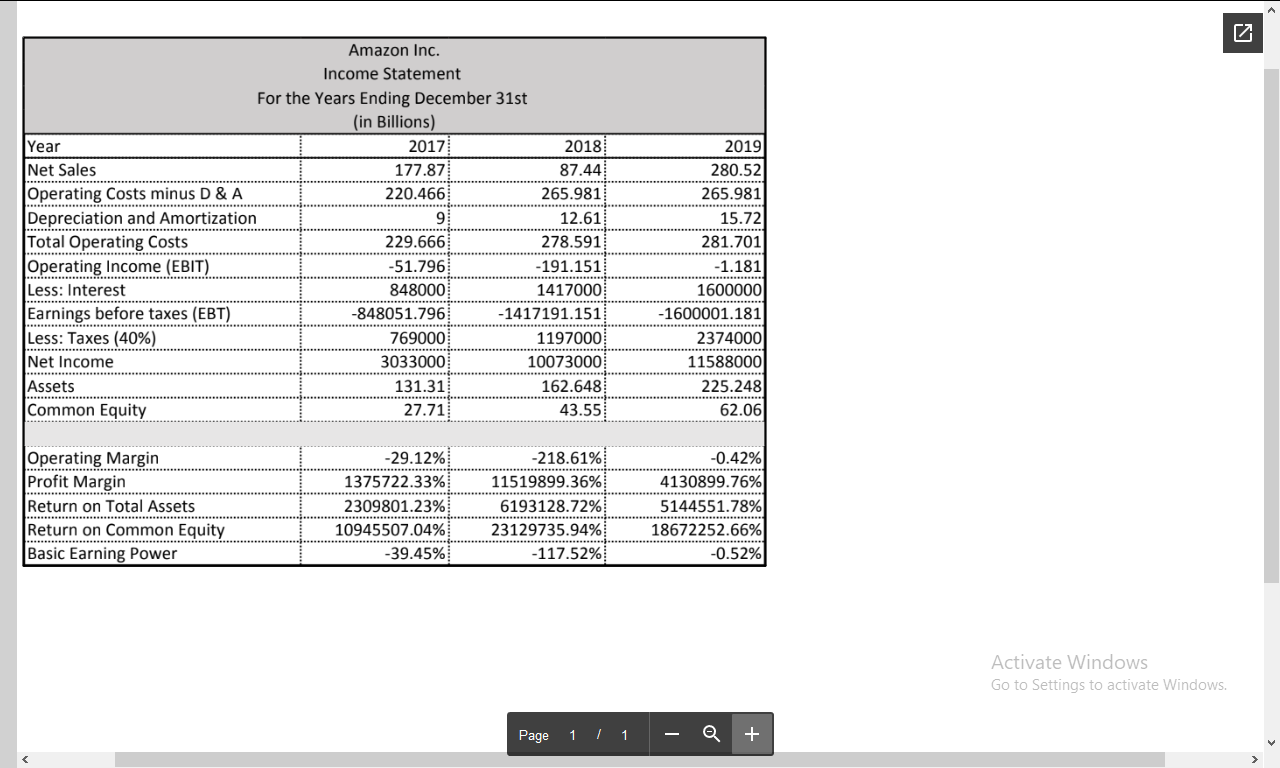
Amazon Inc. Income Statement For the Years Ending December 31st (in Billions) Year 2017 2018 Net Sales 177.87 87.44 Operating costs minus D & A 220.466 265.981 Depreciation and Amortization 12.61 Total Operating costs 229.666 278.591 Operating Income (EBIT) -51.796 -191.151 Less: Interest 848000 1417000 Earnings before taxes (EBT) -848051.796 -1417191.151 Less: Taxes (40%) 769000 1197000 Net Income 3033000 10073000 Assets 131.31 162.648 Common Equity 27.71 43.55 2019 280.52 265.981 15.72 281.701 -1.181 1600000 -1600001.181 2374000 11588000 225.248 62.06 Operating Margin Profit Margin Return on Total Assets Return on Common Equity Basic Earning Power -29.12% 1375722.33% 2309801.23% 10945507.04% -39.45% -218.61% 11519899.36% 6193128.72% 23129735.94% -117.52% -0.42% 4130899.76% 5144551.78% 18672252.66% -0.52% 1 Activate Windows Go to Settings to activate Windows. Page 111 - a + Amazon Inc. Income Statement For the Years Ending December 31st (in Billions) Year 2017 2018 Net Sales 177.87 87.44 Operating costs minus D & A 220.466 265.981 Depreciation and Amortization 12.61 Total Operating costs 229.666 278.591 Operating Income (EBIT) -51.796 -191.151 Less: Interest 848000 1417000 Earnings before taxes (EBT) -848051.796 -1417191.151 Less: Taxes (40%) 769000 1197000 Net Income 3033000 10073000 Assets 131.31 162.648 Common Equity 27.71 43.55 2019 280.52 265.981 15.72 281.701 -1.181 1600000 -1600001.181 2374000 11588000 225.248 62.06 Operating Margin Profit Margin Return on Total Assets Return on Common Equity Basic Earning Power -29.12% 1375722.33% 2309801.23% 10945507.04% -39.45% -218.61% 11519899.36% 6193128.72% 23129735.94% -117.52% -0.42% 4130899.76% 5144551.78% 18672252.66% -0.52% 1 Activate Windows Go to Settings to activate Windows. Page 111 - a +
Step by Step Solution
There are 3 Steps involved in it

Get step-by-step solutions from verified subject matter experts