

Question: clear all % clears all active variables close all clc load('ecg_Noisy'); L = length(x); T = 1/fs; %sampling interval t=[0:L-1]*T; figure plot(t, x) axis tight;
![L = length(x); T = 1/fs; %sampling interval t=[0:L-1]*T; figure plot(t, x)](https://dsd5zvtm8ll6.cloudfront.net/si.experts.images/questions/2024/09/66f3d70aa8239_33066f3d70a4863e.jpg)
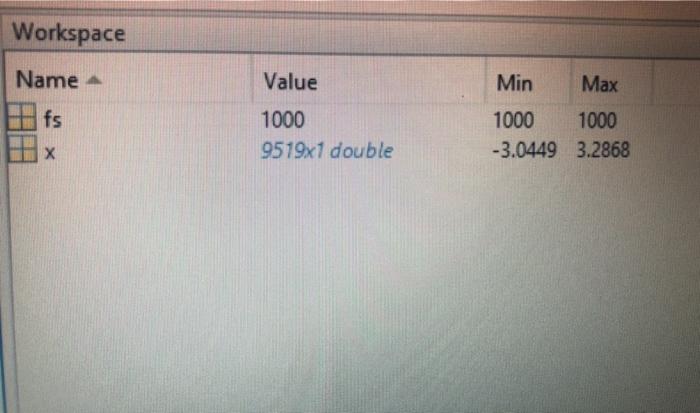
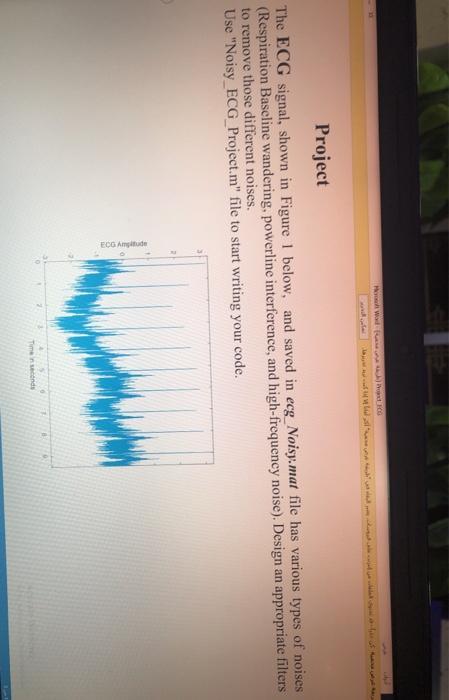
Wod w Project The ECG signal, shown in Figure 1 below, and saved in ecg_Noisy. mat file has various types of noises (Respiration Baseline wandering, powerline interference, and high-frequency noise). Design an appropriate filters to remove those different noises. Use "Noisy ECG_Project.m" file to start writing your code. ECO Ante Timeconds Noisy ECG_Project.mx + #clears all active variables clear all close all clc load('ecg_Noisy'); L = length(x): T-1/ts: sampling interval =[0:L-1]*T. figure plot(t, x) axis tight: wlabel('Time in seconds) ylabel('ECG Amplitude'); X= abs(fftshift(ft (x))), fourier transfrom of the ECG signal fo=fs/L: f= [-L/2:L/2-11 fo: figure plot(t, x) axis tight #label (deequency in HP) ylabel (EG Spectrum); Workspace Name Value Min Max fs 1000 1000 9519x1 double 1000 -3.0449 3.2868 Wod w Project The ECG signal, shown in Figure 1 below, and saved in ecg_Noisy. mat file has various types of noises (Respiration Baseline wandering, powerline interference, and high-frequency noise). Design an appropriate filters to remove those different noises. Use "Noisy ECG_Project.m" file to start writing your code. ECO Ante Timeconds Noisy ECG_Project.mx + #clears all active variables clear all close all clc load('ecg_Noisy'); L = length(x): T-1/ts: sampling interval =[0:L-1]*T. figure plot(t, x) axis tight: wlabel('Time in seconds) ylabel('ECG Amplitude'); X= abs(fftshift(ft (x))), fourier transfrom of the ECG signal fo=fs/L: f= [-L/2:L/2-11 fo: figure plot(t, x) axis tight #label (deequency in HP) ylabel (EG Spectrum); Workspace Name Value Min Max fs 1000 1000 9519x1 double 1000 -3.0449 3.2868
Step by Step Solution
There are 3 Steps involved in it

Get step-by-step solutions from verified subject matter experts