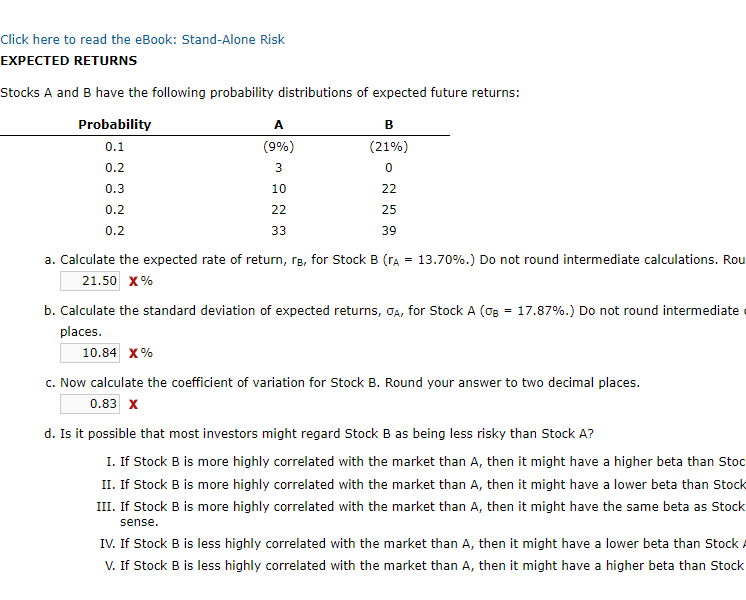
Question: Click here to read the eBook: Stand-Alone Risk EXPECTED RETURNS Stocks A and B have the following probability distributions of expected future returns: Probability A

Click here to read the eBook: Stand-Alone Risk
Click here to read the eBook: Stand-Alone Risk EXPECTED RETURNS Stocks A and B have the following probability distributions of expected future returns: Probability A B 0.1 (9%) (21%) 0.2 3 0 0.2 10 22 0.2 22 25 0.2 33 39 a. Calculate the expected rate of return, rg, for Stock B {ru = 13.70%.) Do not round intermediate calculations. Rou 21.50 X% b. Calculate the standard deviation of expected returns, oa, for Stock A (og = 17.87%.) Do not round intermediate places. 10.84 X% c. Mow calculate the coefficient of variation for Stock B. Round your answer to two decimal places. 0.83 X d. Is it possible that most investors might regard Stock B as being less risky than Stock A7 I. If Stock B is more highly correlated with the market than A, then it might have a higher beta than Stoc II. If Stock B is more highly correlated with the market than A, then it might have a lower beta than Stock III. If Stock B is more highly correlated with the market than A, then it might have the same beta as Stock sense, IV, If Stock B is less highly correlated with the market than &, then it might have a lower beta than Stock V. If Stock B is less highly correlated with the market than A, then it might have a higher beta than Stock

Step by Step Solution

There are 3 Steps involved in it

1 Expert Approved Answer
Step: 1 Unlock blur-text-image
Question Has Been Solved by an Expert!

Get step-by-step solutions from verified subject matter experts

Step: 2 Unlock
Step: 3 Unlock

Students Have Also Explored These Related Finance Questions!