

Question: Coffee/Tea Canned Snacks & Candy Fall Fall Fall Other Table 1 ASP $ $ $ $ 2009 3,136.48 (1,874.29) 1,262.19 (750.00) (250.00) Spring 2010 3,250.97
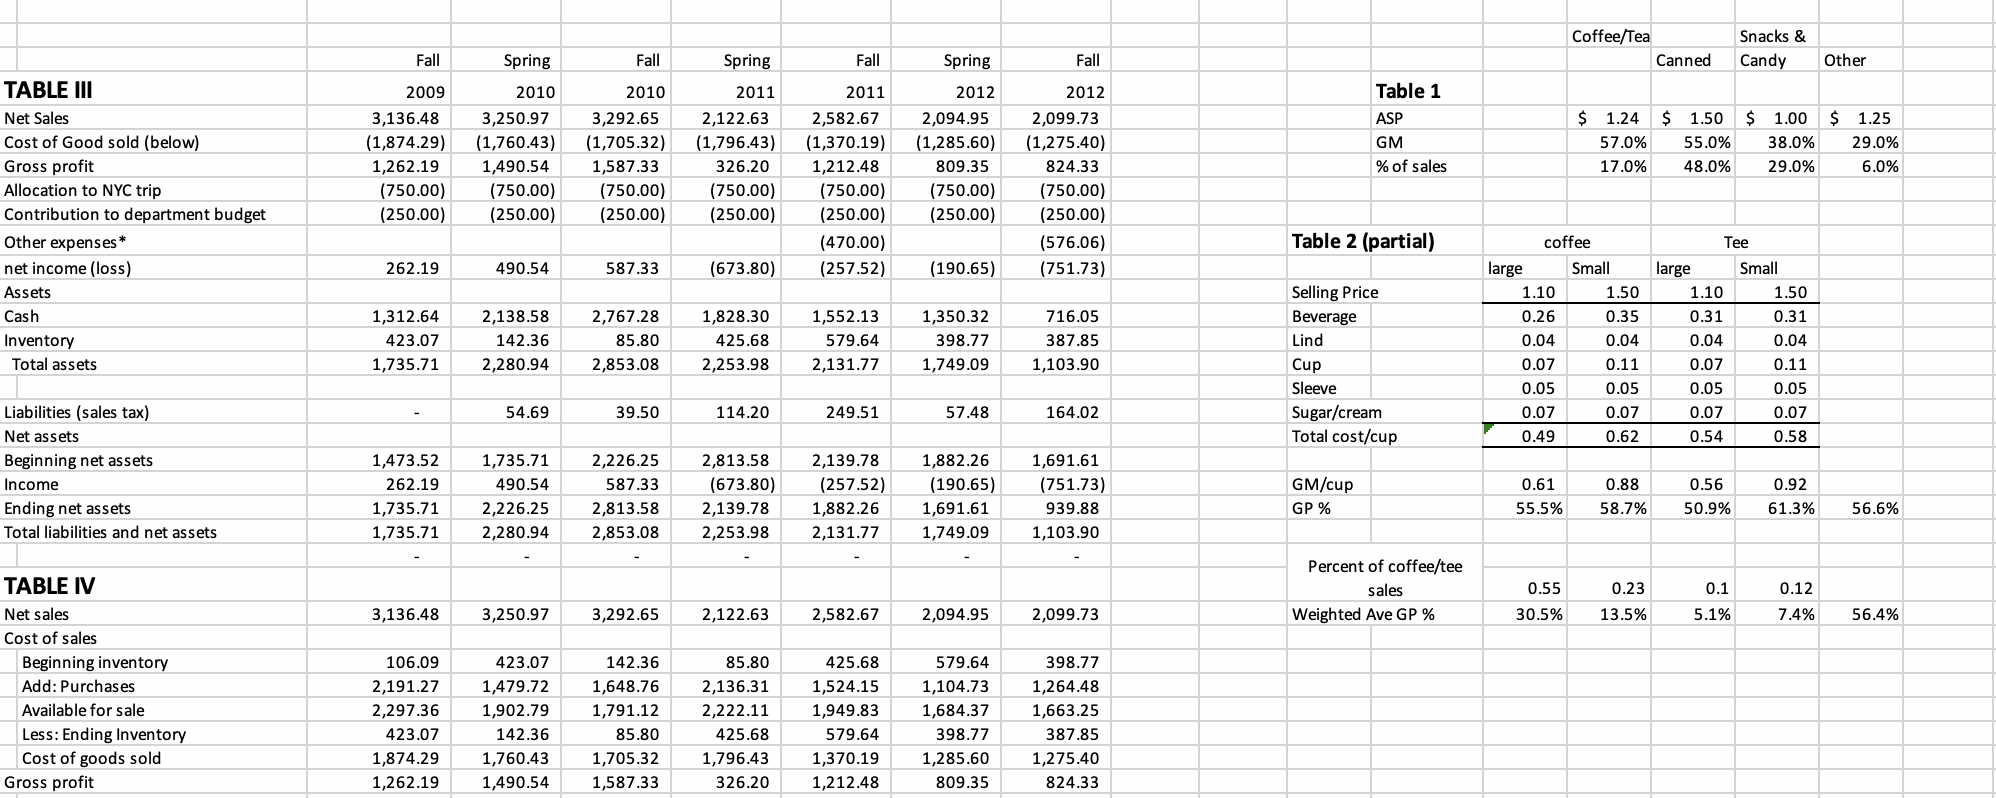
Coffee/Tea Canned Snacks & Candy Fall Fall Fall Other Table 1 ASP $ $ $ $ 2009 3,136.48 (1,874.29) 1,262.19 (750.00) (250.00) Spring 2010 3,250.97 (1,760.43) 1,490.54 (750.00) (250.00) 2010 3,292.65 (1,705.32) 1,587.33 (750.00) (250.00) Spring 2011 2,122.63 (1,796.43) 326.20 (750.00) (250.00) Fall 2011 2,582.67 (1,370.19) 1,212.48 (750.00) (250.00) (470.00) (257.52) Spring 2012 2,094.95 (1,285.60) 809.35 (750.00) (250.00) GM % of sales 1.24 57.0% 17.0% 1.50 55.0% 48.0% 1.00 38.0% 29.0% TABLE III Net Sales Cost of Good sold (below) Gross profit Allocation to NYC trip Contribution to department budget Other expenses * net income (loss) Assets Cash Inventory Total assets 1.25 29.0% 6.0% 2012 2,099.73 (1,275.40) 824.33 (750.00) (250.00) (576.06) (751.73) Table 2 (partial) 262.19 490.54 587.33 (673.80) (190.65) 1,312.64 423.07 1,735.71 2,138.58 142.36 2,280.94 2,767.28 85.80 2,853.08 1,828.30 425.68 2,253.98 1,552.13 579.64 2,131.77 1,350.32 398.77 1,749.09 716.05 387.85 1,103.90 Selling Price Beverage Lind Cup Sleeve Sugar/cream Total cost/cup coffee large Small 1.10 1.50 0.26 0.35 0.04 0.04 0.07 0.11 0.05 0.05 0.07 0.07 0.49 0 .62 Tee large Small 1.10 1.50 0.31 0.31 0.04 0.04 0.07 0.11 0.05 0.05 0.07 0.07 0.54 0.58 54.69 39.50 114.20 249.51 57.48 164.02 Liabilities (sales tax) Net assets Beginning net assets Income Ending net assets Total liabilities and net assets 1,473.52 262.19 1,735.71 1,735.71 1,735.71 490.54 2,226.25 2,280.94 2,226.25 587.33 2,813.58 2,853.08 2,813.58 (673.80) 2,139.78 2,253.98 2,139.78 (257.52) 1,882.26 2,131.77 1,882.26 (190.65) 1,691.61 1,749.09 1,691.61 (751.73) 939.88 1,103.90 GM/cup GP % 0.61 55.5% 0.88 58.7% 0.56 50.9% 0.92 61.3% 56.6% Percent of coffee/tee sales 0.55 30.5% 0.23 13.5% 0.1 5.1% 0.12 7.4% 3,136.48 3,250.97 3,292.65 2,122.63 2,582.67 2,094.95 2,099.73 Weighted Ave GP % 56.4% TABLE IV Net sales Cost of sales Beginning inventory Add: Purchases Available for sale Less: Ending Inventory Cost of goods sold Gross profit 106.09 2,191.27 2,297.36 423.07 1,874.29 1,262.19 423.07 1,479.72 1,902.79 142.36 1,760.43 1,490.54 142.36 1,648.76 1,791.12 85.80 1,705.32 1,587.33 85.80 2,136.31 2,222.11 425.68 1,796.43 326.20 425.68 1,524.15 1,949.83 579.64 1,370.19 1,212.48 579.64 1,104.73 1,684.37 398.77 1,285.60 809.35 398.77 1,264.48 1,663.25 387.85 1,275.40 824.33 Assuming that the Shop accepts FoodFunds in the spring 2013 semester, prepare a pro-forma contribution margin income statement. Use the average sales and cost data presented for previous semesters and the new costs of FoodFunds to complete this exercise. Show computations for each line. Coffee/Tea Canned Snacks & Candy Fall Fall Fall Other Table 1 ASP $ $ $ $ 2009 3,136.48 (1,874.29) 1,262.19 (750.00) (250.00) Spring 2010 3,250.97 (1,760.43) 1,490.54 (750.00) (250.00) 2010 3,292.65 (1,705.32) 1,587.33 (750.00) (250.00) Spring 2011 2,122.63 (1,796.43) 326.20 (750.00) (250.00) Fall 2011 2,582.67 (1,370.19) 1,212.48 (750.00) (250.00) (470.00) (257.52) Spring 2012 2,094.95 (1,285.60) 809.35 (750.00) (250.00) GM % of sales 1.24 57.0% 17.0% 1.50 55.0% 48.0% 1.00 38.0% 29.0% TABLE III Net Sales Cost of Good sold (below) Gross profit Allocation to NYC trip Contribution to department budget Other expenses * net income (loss) Assets Cash Inventory Total assets 1.25 29.0% 6.0% 2012 2,099.73 (1,275.40) 824.33 (750.00) (250.00) (576.06) (751.73) Table 2 (partial) 262.19 490.54 587.33 (673.80) (190.65) 1,312.64 423.07 1,735.71 2,138.58 142.36 2,280.94 2,767.28 85.80 2,853.08 1,828.30 425.68 2,253.98 1,552.13 579.64 2,131.77 1,350.32 398.77 1,749.09 716.05 387.85 1,103.90 Selling Price Beverage Lind Cup Sleeve Sugar/cream Total cost/cup coffee large Small 1.10 1.50 0.26 0.35 0.04 0.04 0.07 0.11 0.05 0.05 0.07 0.07 0.49 0 .62 Tee large Small 1.10 1.50 0.31 0.31 0.04 0.04 0.07 0.11 0.05 0.05 0.07 0.07 0.54 0.58 54.69 39.50 114.20 249.51 57.48 164.02 Liabilities (sales tax) Net assets Beginning net assets Income Ending net assets Total liabilities and net assets 1,473.52 262.19 1,735.71 1,735.71 1,735.71 490.54 2,226.25 2,280.94 2,226.25 587.33 2,813.58 2,853.08 2,813.58 (673.80) 2,139.78 2,253.98 2,139.78 (257.52) 1,882.26 2,131.77 1,882.26 (190.65) 1,691.61 1,749.09 1,691.61 (751.73) 939.88 1,103.90 GM/cup GP % 0.61 55.5% 0.88 58.7% 0.56 50.9% 0.92 61.3% 56.6% Percent of coffee/tee sales 0.55 30.5% 0.23 13.5% 0.1 5.1% 0.12 7.4% 3,136.48 3,250.97 3,292.65 2,122.63 2,582.67 2,094.95 2,099.73 Weighted Ave GP % 56.4% TABLE IV Net sales Cost of sales Beginning inventory Add: Purchases Available for sale Less: Ending Inventory Cost of goods sold Gross profit 106.09 2,191.27 2,297.36 423.07 1,874.29 1,262.19 423.07 1,479.72 1,902.79 142.36 1,760.43 1,490.54 142.36 1,648.76 1,791.12 85.80 1,705.32 1,587.33 85.80 2,136.31 2,222.11 425.68 1,796.43 326.20 425.68 1,524.15 1,949.83 579.64 1,370.19 1,212.48 579.64 1,104.73 1,684.37 398.77 1,285.60 809.35 398.77 1,264.48 1,663.25 387.85 1,275.40 824.33 Assuming that the Shop accepts FoodFunds in the spring 2013 semester, prepare a pro-forma contribution margin income statement. Use the average sales and cost data presented for previous semesters and the new costs of FoodFunds to complete this exercise. Show computations for each line
Step by Step Solution
There are 3 Steps involved in it

Get step-by-step solutions from verified subject matter experts